Can XRP price hit $1? Watch these levels next

The price of XRP (XRP $0.77) has skyrocketed after a federal court ruling declaring that its sales on crypto exchanges complied with United States securities laws.
On July 14, the XRP price retreated by about 10% to $0.76, but compared with its lowest price the previous day, it was still up around 65%.
At its highest in the last 24 hours, the XRP/USD pair reached $0.93, its best level since December 2021, just shy of hitting the $1 mark.
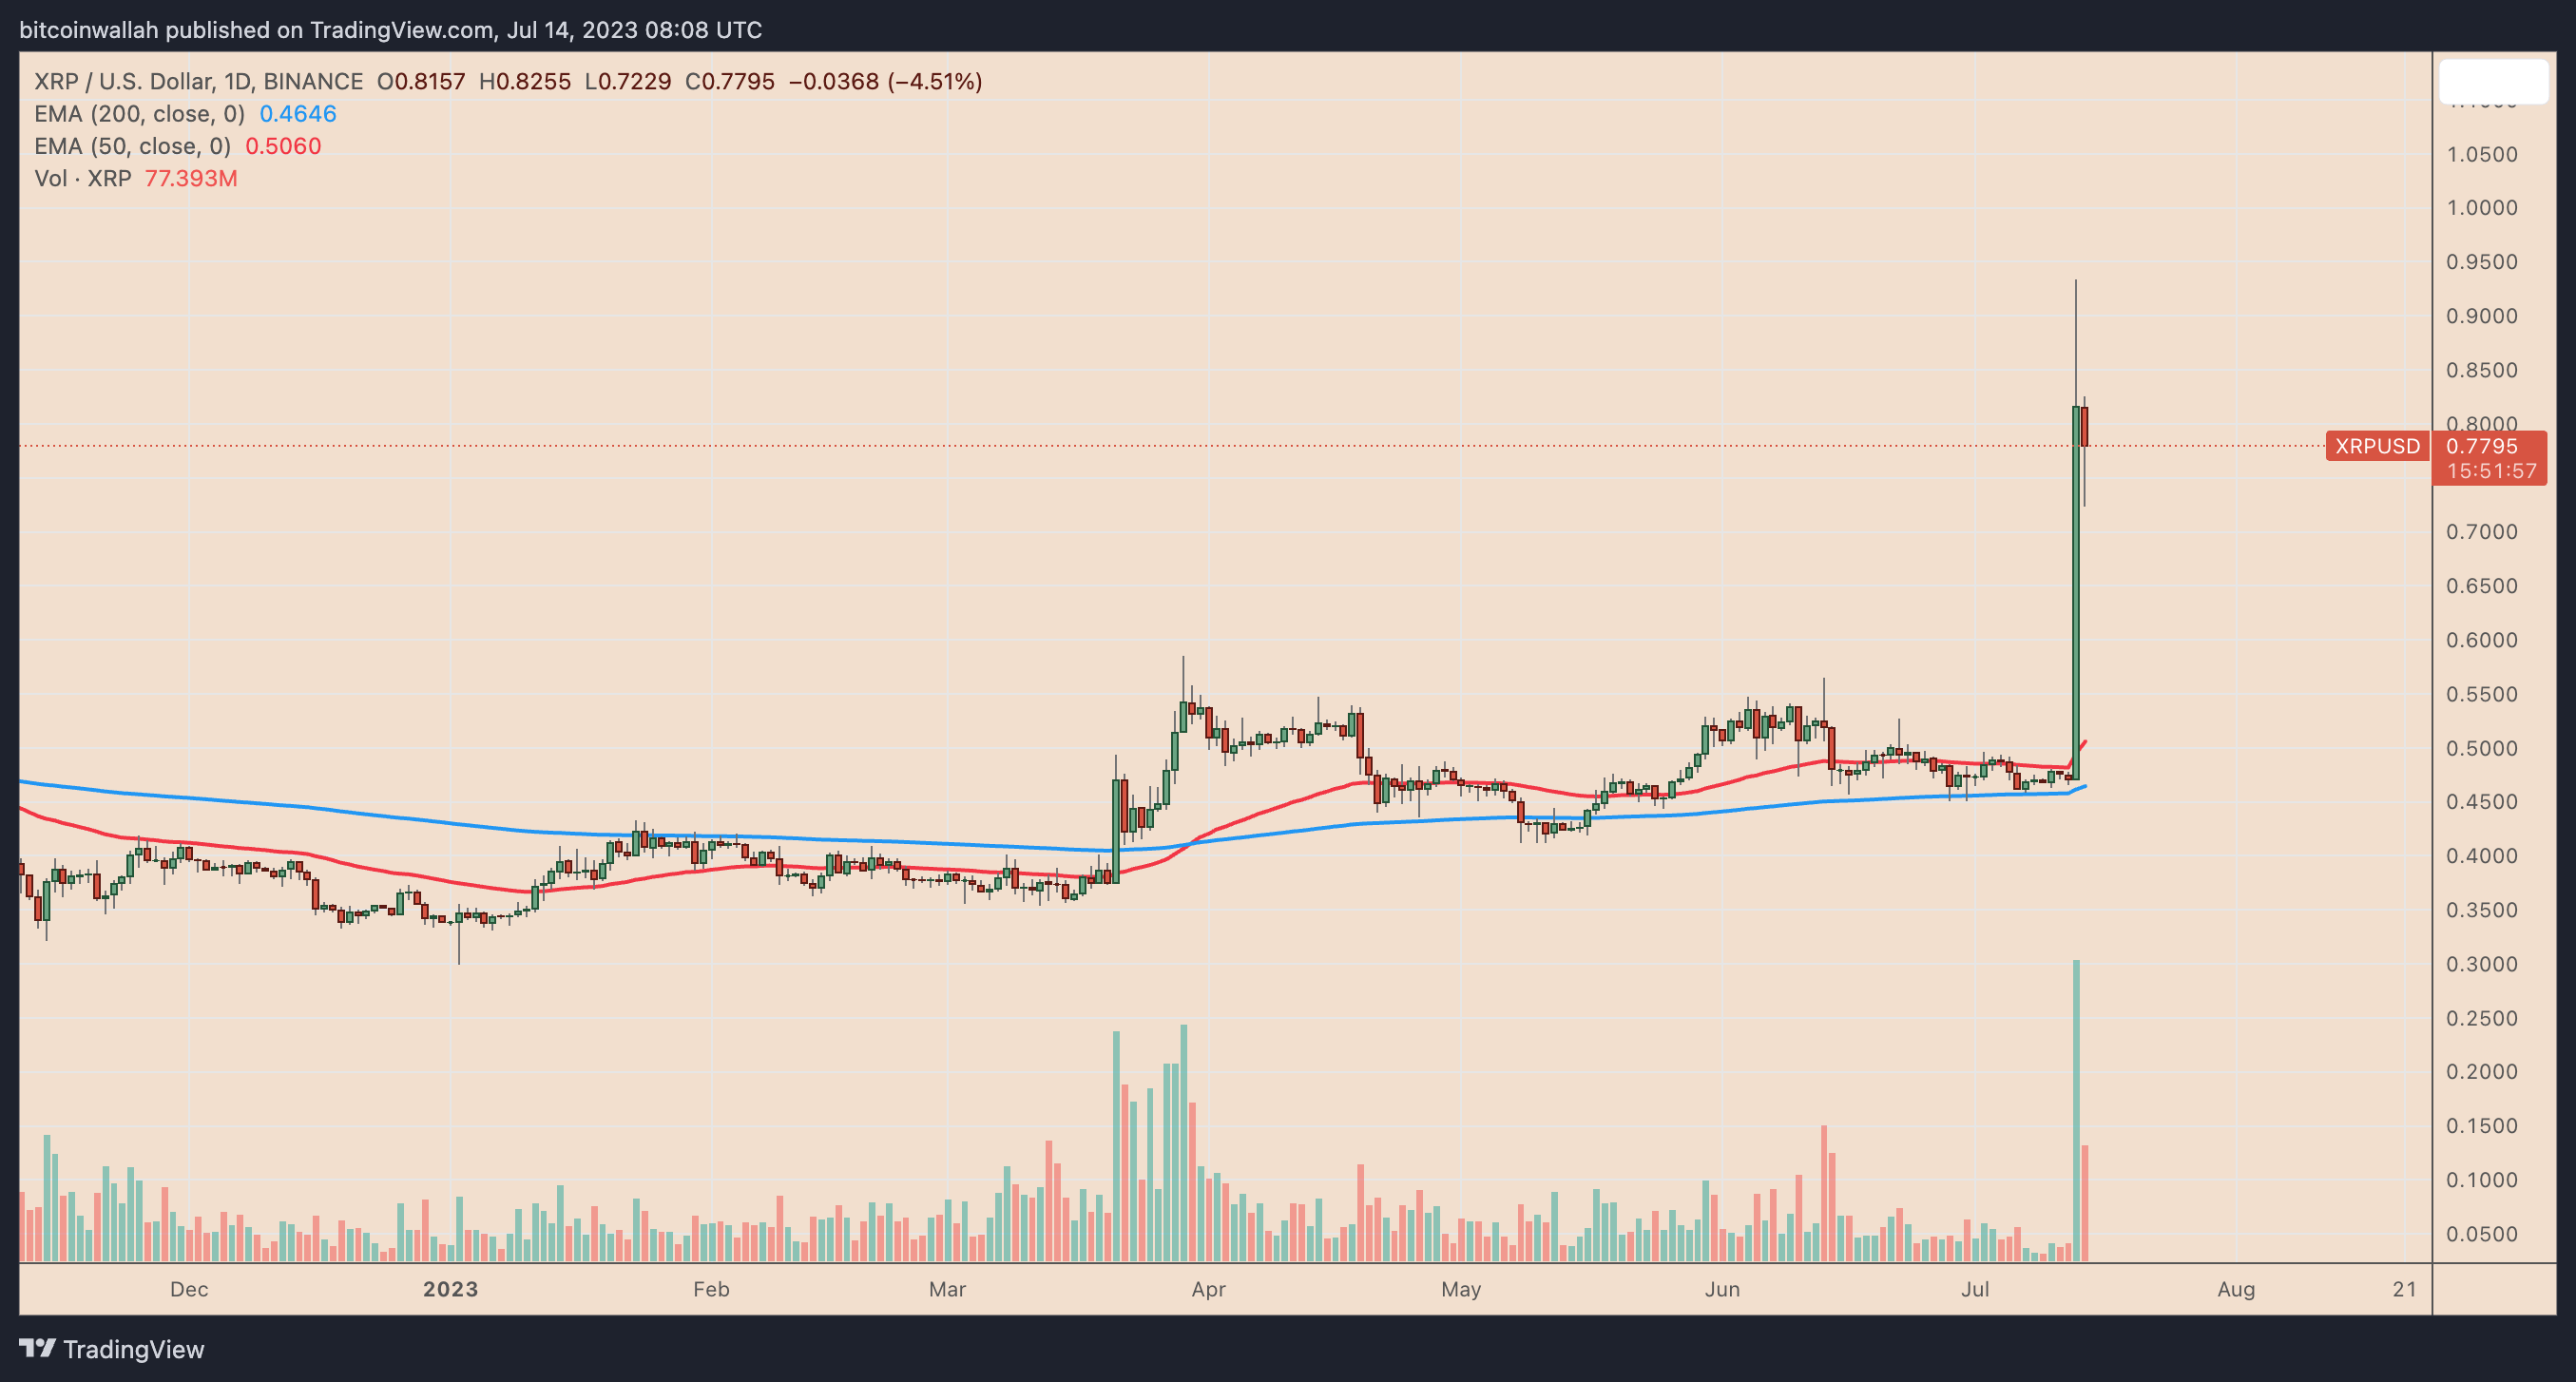
XRP/USD daily price chart. Source: TradingView
A whale-backed XRP rally
Certain indicators show that XRP’s ongoing price pump may not be just a short-term reaction to the positive news for Ripple.
For instance, the duration of XRP’s massive pump coincides with its trading volumes reaching a 10-month high. Meanwhile, the number of XRP whale transactions — wallets holding more than $100,000 — climbed to their best level in 2023, suggesting that the wealthiest investors back the XRP rally.
“If key whale and shark addresses are increasing their supply going into this pump, then it is a get foreshadowing signal that the pump may just be getting started, and it’s a sign of good things to come,” stated Brian Q, an analyst at data analytics platform Santiment.
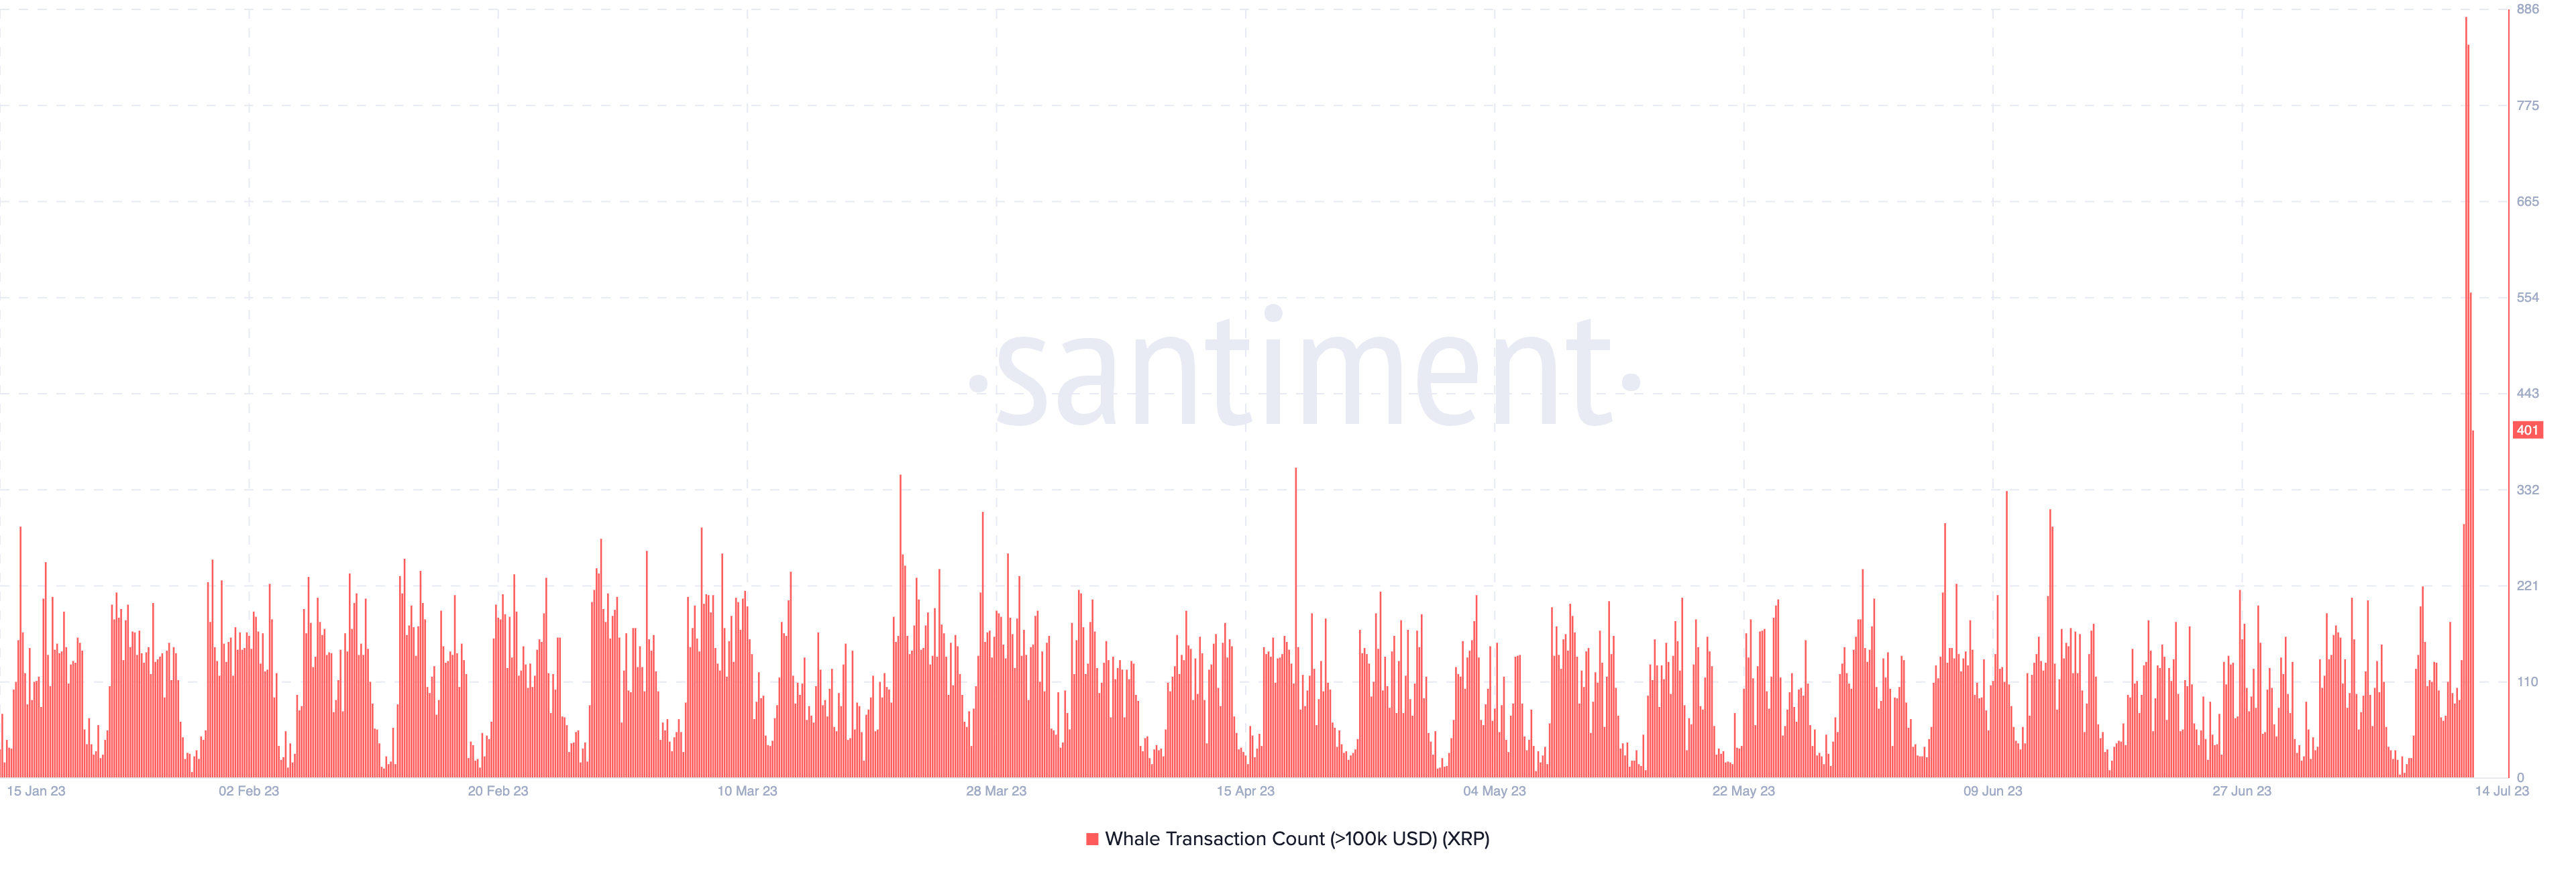
Whale transaction count (>$100K). Source: Santiment
Furthermore, the XRP price gains come in line with a rise in the supply held by entities with a 100,000–10 million token balance.
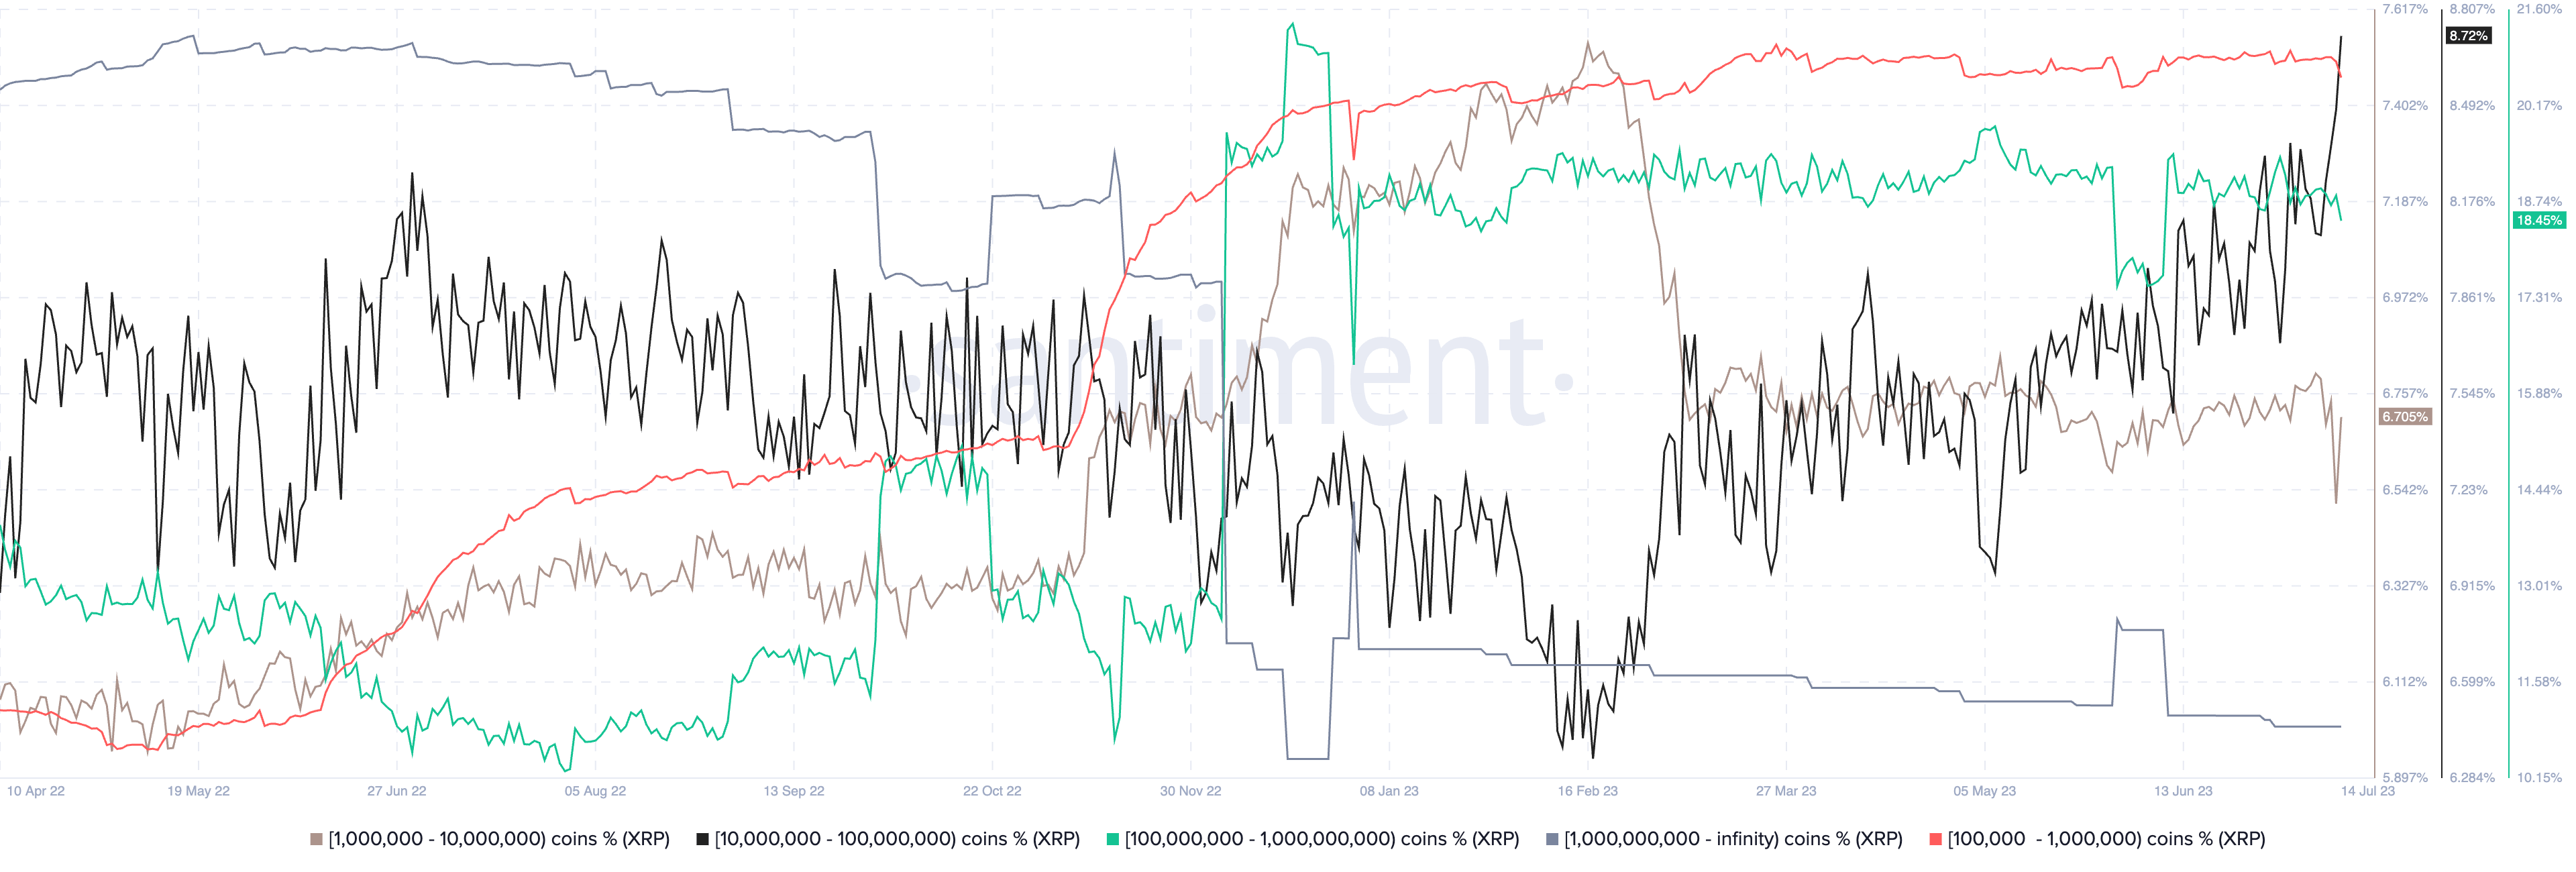
XRP supply held by whales. Source: Santiment
In other words, whales have not sold the rally but accumulated XRP, suggesting most want to position themselves for further gains.
XRP to $1 and beyond?
From a technical standpoint, XRP can test the key $1 level in the coming days, but its potential to continue its rally beyond looks weak for the time being.
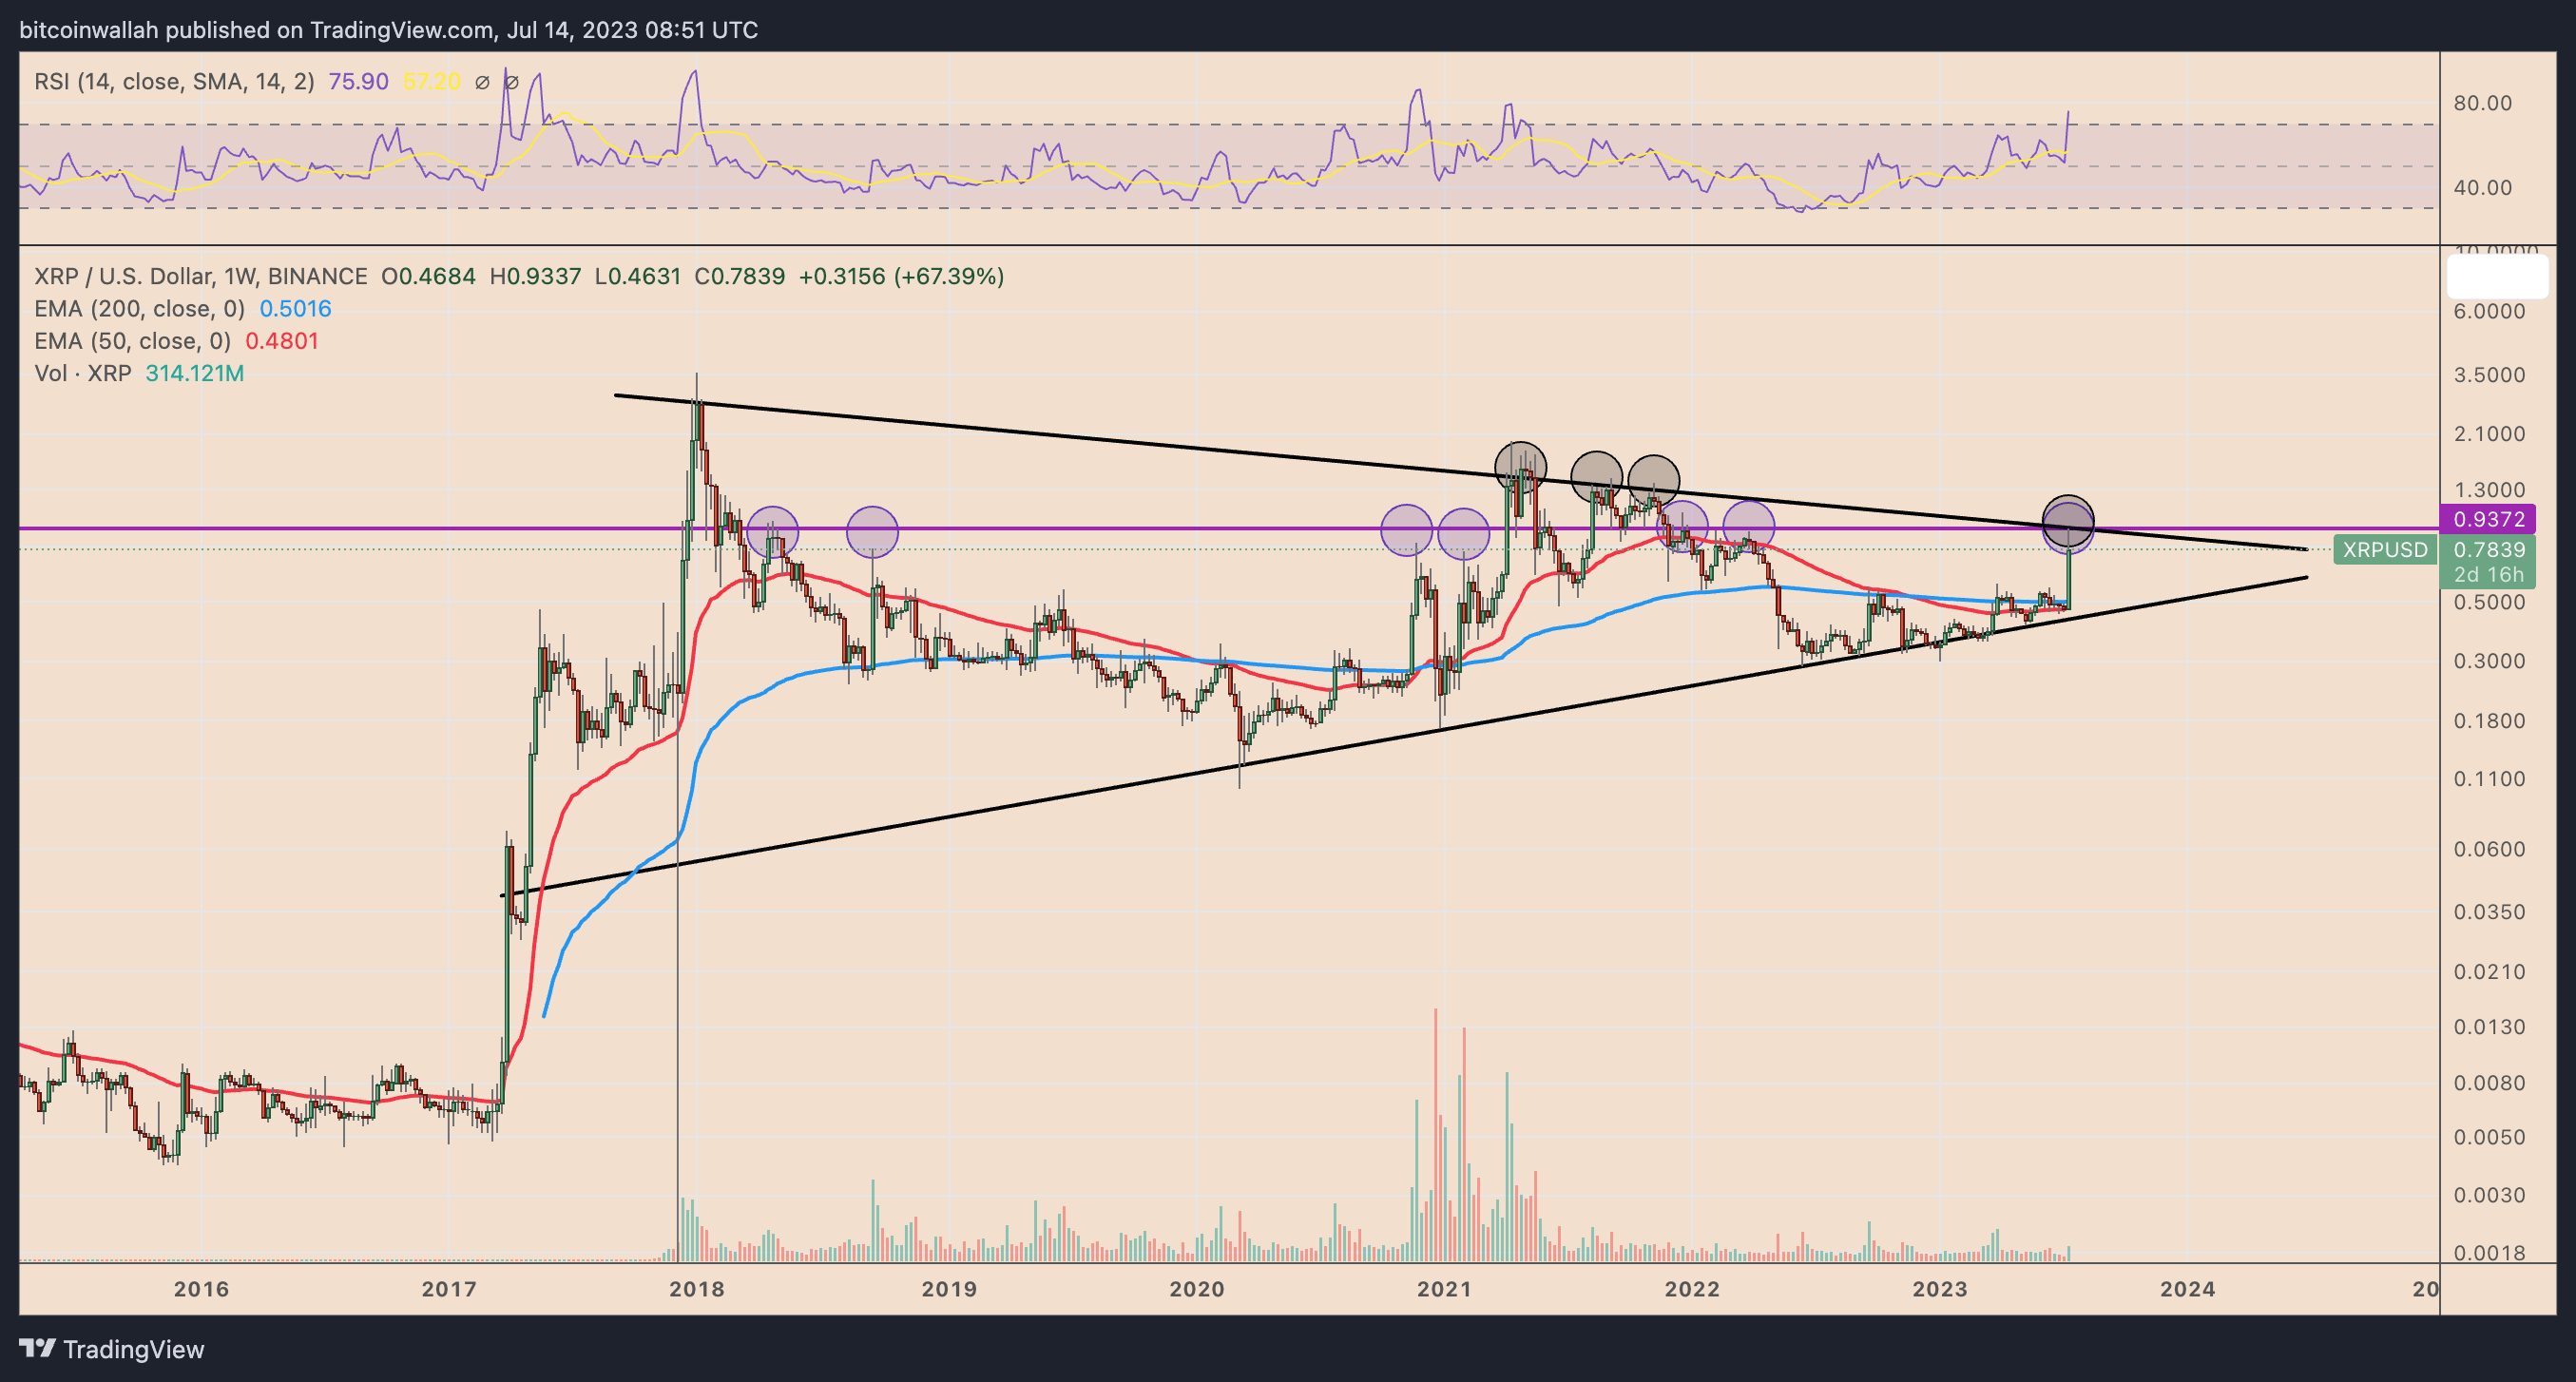
Notably, the pullback on July 14 occurred near a resistance confluence comprising a multiyear horizontal trendline (purple) and a giant descending trendline ceiling (black).
In addition, XRP’s weekly relative strength index (RSI) has turned overbought, raising its correction prospects.
XRP/USD daily price chart. Source: TradingView
Should a pullback occur, XRP price risks dropping toward its multiyear ascending trendline support near $0.45 by September, down around 55% from the current price level.
Other price targets include the token’s 50-week exponential moving average (50-week EMA; the red wave) near $0.48 and 200-week EMA (the blue wave) near $0.50.
On the other hand, an overbought RSI could also result in the XRP price consolidating sideways inside the $0.75–$1 range.
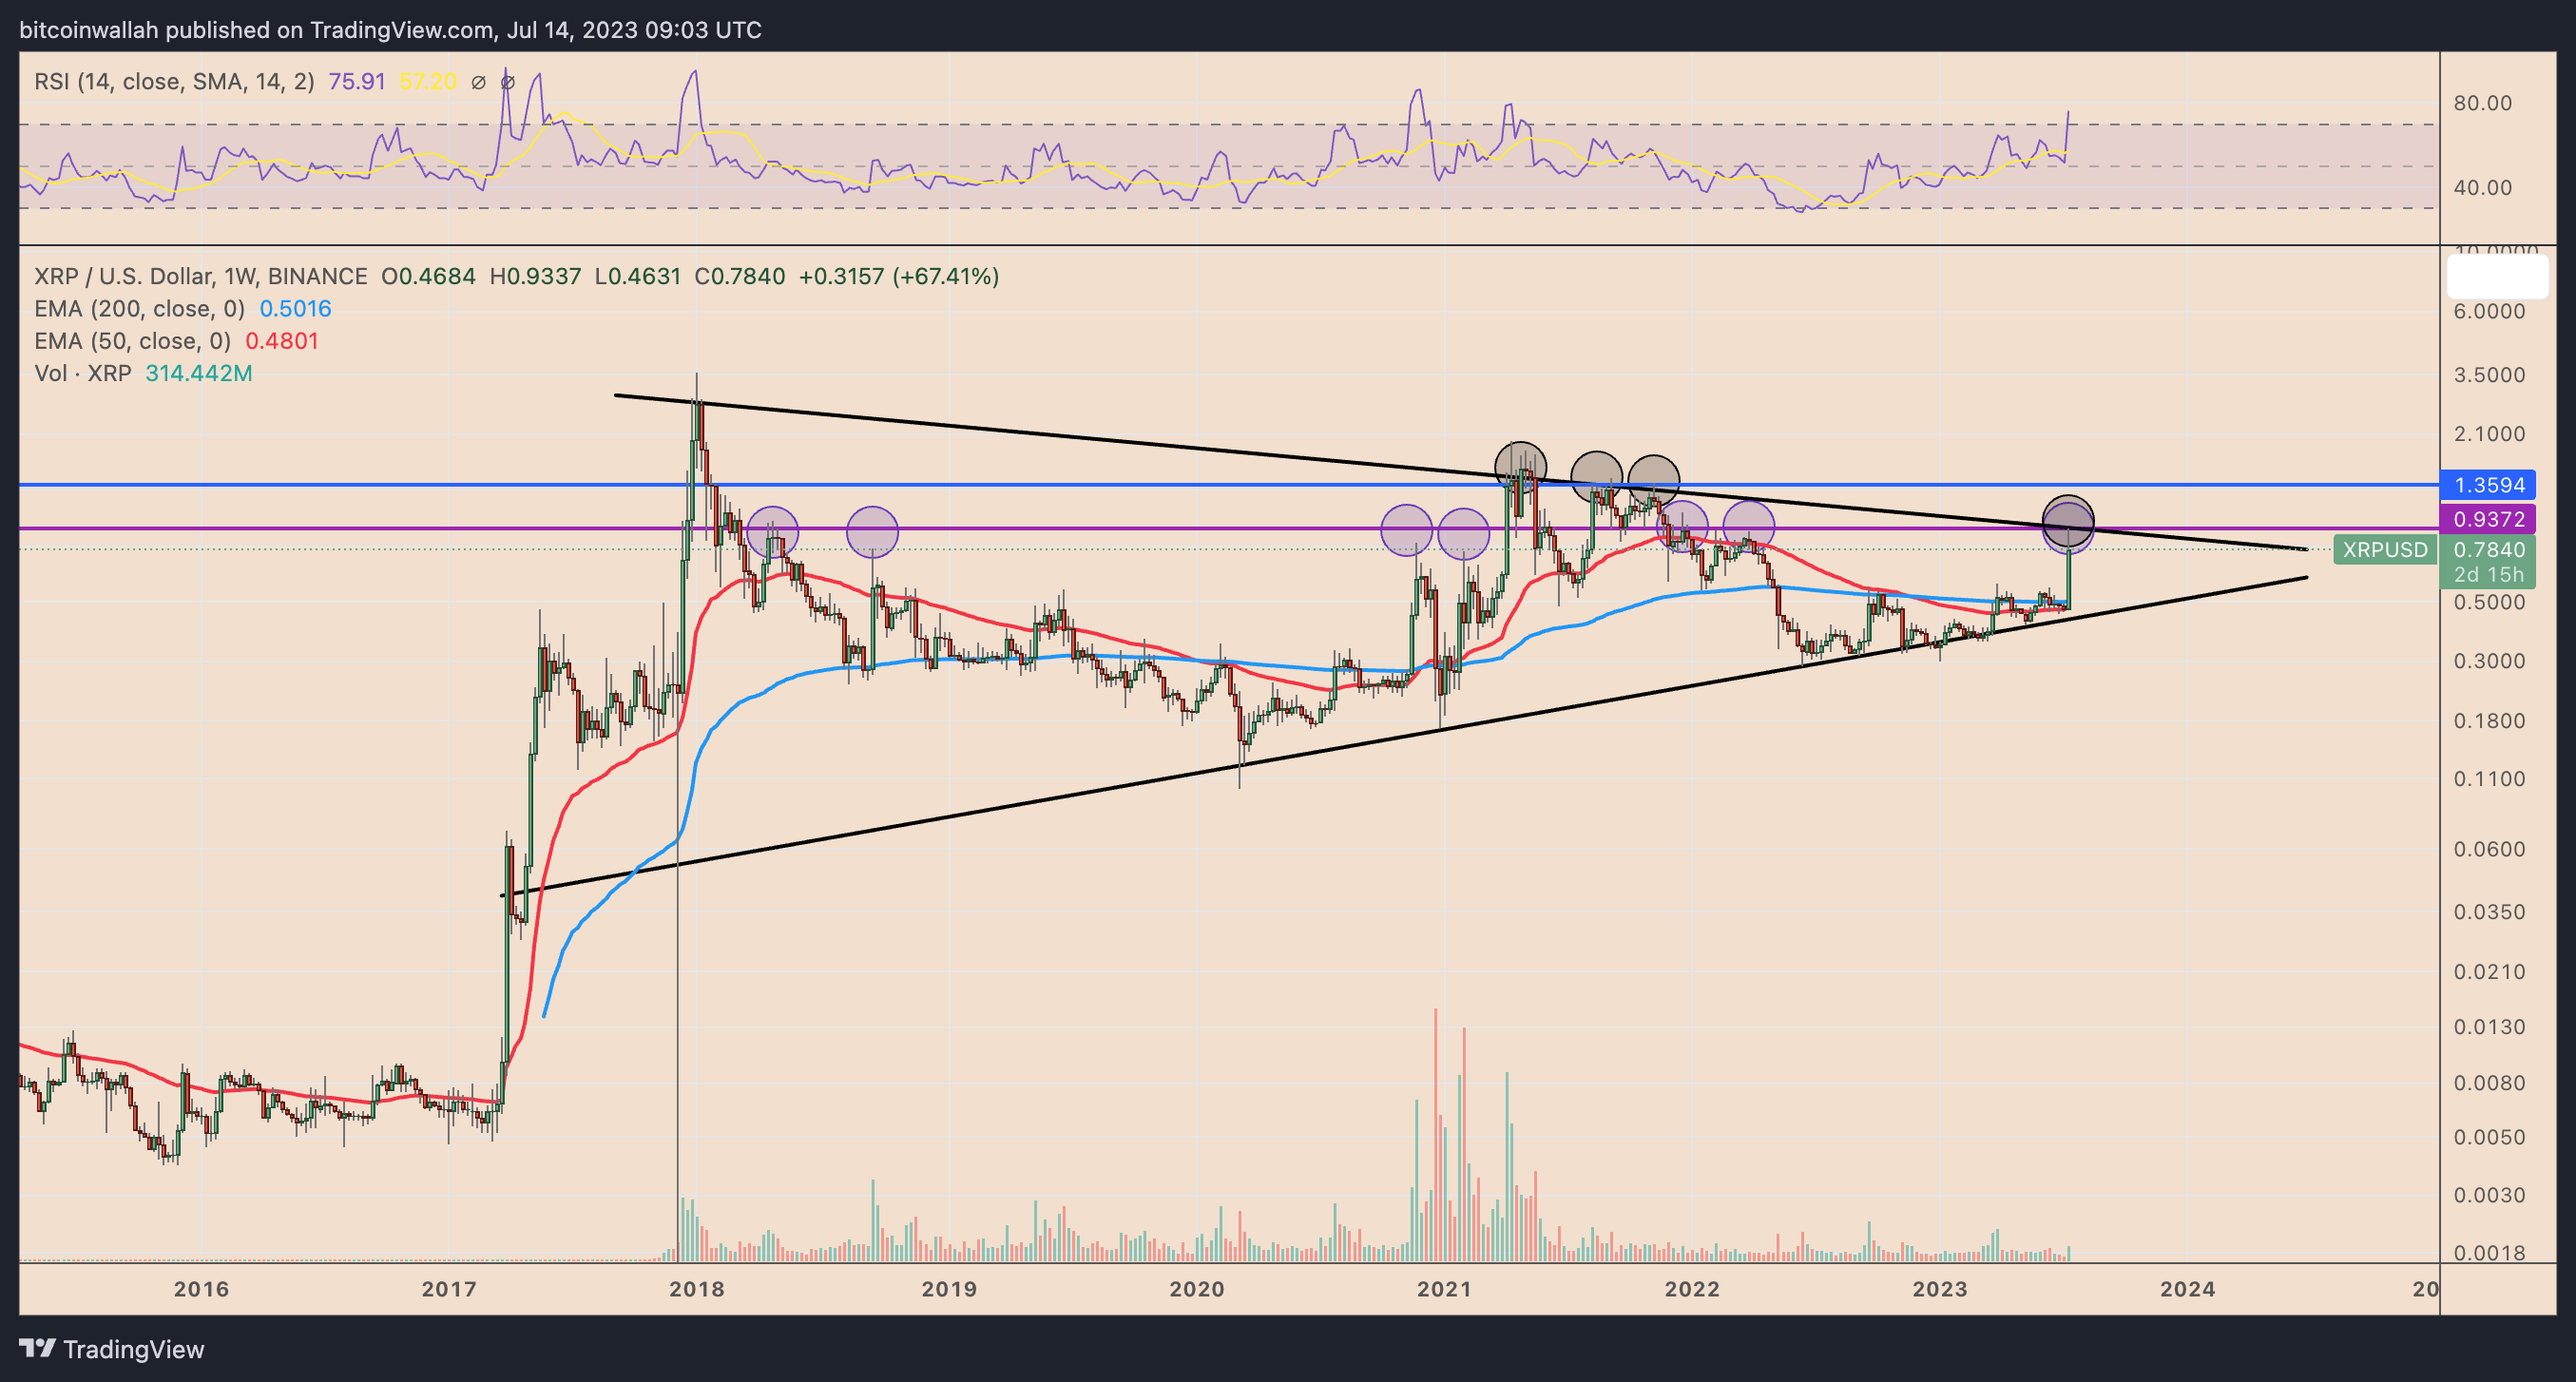
XRP/USD weekly price chart. Source: TradingView
If the XRP price decisively breaks above $1, then its next price target by September will likely be near $1.35, a resistance level from the August to December 2021 session.
Author

Cointelegraph Team
Cointelegraph
We are privileged enough to work with the best and brightest in Bitcoin.


