Can PEPE price manifest a 25% rally amid bearish market conditions?
- PEPE price has developed a bullish divergence on the two-hour chart, forecasting bullish outlook.
- If successfully resolved, the buy signal could result in a 25% upswing
- A decisive flip of the $0.00000147 level will create a lower low and invalidate the bullish thesis.

PEPE price has set up a bullish divergence on two-hour chart, forecasting a quick rally for the altcoin. Depending on how buyers play their hands, there is a nice opportunity in the next few days.
Also read: SHIB vs PEPE: Why Pepe could never dethrone Shiba Inu
PEPE price needs to take a decision soon
PEPE price has produced three lower lows since May 17, while the Relative Strength Index (RSI) and the Awesome Oscillator (AO) have produced higher lows. This non-conformity is termed bullish divergence.
Often, this setup resolves in such a way that it propels the underlying asset higher. In this case, the technical formation could catalyze a 24% rally for PEPE price. However, for this rally to be successful, the meme coin needs to overcome the $0.00000164 hurdle.
Successfully overcoming the aforementioned resistance level and flipping it into a support floor could mean PEPE price will retest $0.00000195.
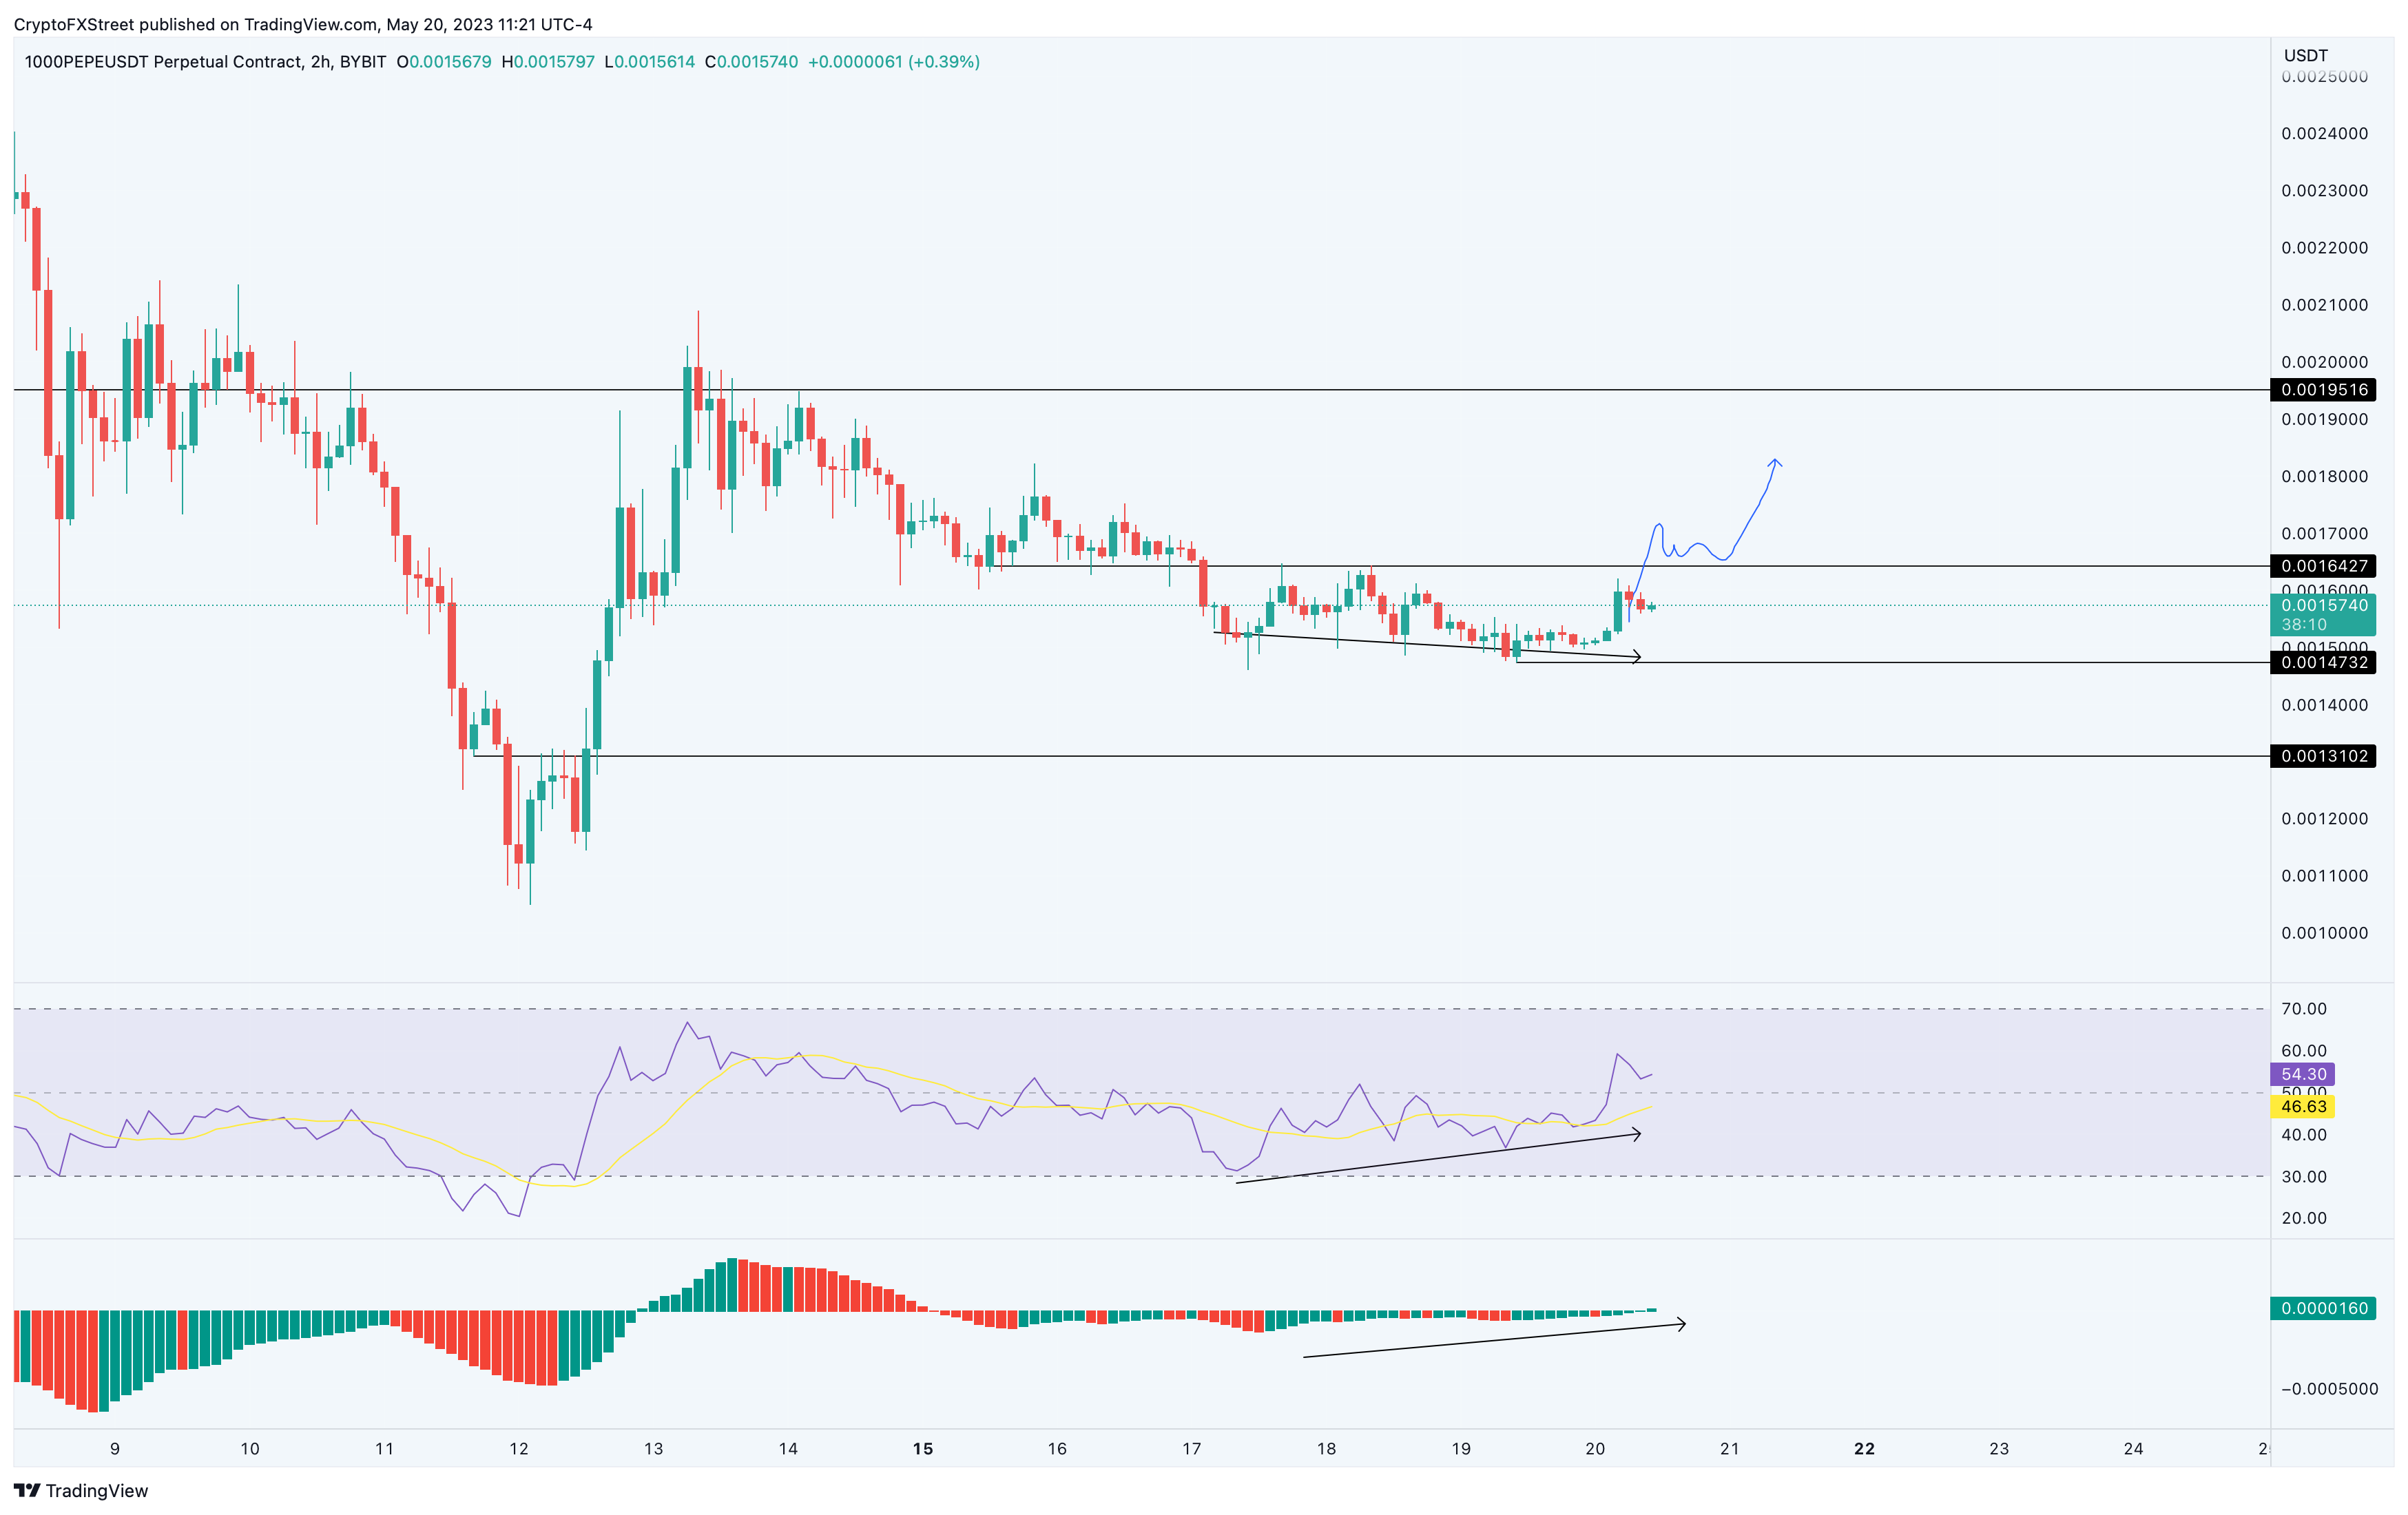
PEPE/USDT 2-hour chart
Regardless of the optimism witnessed in the PEPE price action, investors need to be cautious of the market outlook, which is primarily bearish. If Bitcoin price triggers a selloff, altcoins, including PEPE could follow suit.
In such a case, if PEPE price produces a lower low below $0.00000147, it would invalidate the bullish thesis. Such a development could see the meme coin drop by 11% and tag the $0.00000131 support floor.
Author

Akash Girimath
FXStreet
Akash Girimath is a Mechanical Engineer interested in the chaos of the financial markets. Trying to make sense of this convoluted yet fascinating space, he switched his engineering job to become a crypto reporter and analyst.



