Buying The Dip: Searching for red candlesticks in bull market is a profitable strategy
- Bull markets come with opportunities to buy the dip that are incredibly profitable.
- Moving averages play a vital role in identifying nearly precise points of reversal while confirming up trending markets.
- The TD Sequential indicator is key in anticipating local tops and bottoms but should be used with other indexes.

Bull markets often catch investors and traders with their pants down, depleting rather obvious profitable opportunities. Sometimes it’s too late to get into a trade, while other times reversals are quick such that losses incurred are massive. However, it is possible to incorporate a strategy that ensures that trading remains profitable even in bull markets.
How to buy the dip in bull markets
Bullish cycles come with their fair share of dips and retracements. Experienced traders understand that pullbacks are necessary for assets to continue rallying. As an example of this, in BTC’s bullish market between 2016 and 2018, there were approximately ten 30% pullbacks. Exploiting these pullbacks would have resulted in impressive profits.
For instance, Bitcoin made a massive breakout in June 2016, almost brushing shoulders with $800. However, a reversal came into the picture, sending BTC to support highlighted by the 50-day Simple Moving Average above $550. The price bounced off the anchor, catapulting the flagship cryptocurrency above $700.
-637407581529030706.png)
BTC/USD daily chart
Simultaneously, towards the end of 2016, the bellwether cryptocurrency embarked on another remarkable rally, climbing above $1,000 and hitting $1,165 in December. Shortly after, a pullback led to a significant flash drop in January 2017, where BTC/USD revisited levels under $800. Subsequently, the slump presented another buy the dip opportunity from the 100-day SMA. Bitcoin resumed the uptrend in mid-January, followed by a spike to $1,300.
-637407581998433880.png)
BTC/USD daily chart
Similar pullbacks and opportunities to buy the dip can be spotted in the 2018 bull market. It is clear that identifying pullbacks, their supports and waiting for a confirmed breakout is a critical strategy to apply. It is likely to keep the investor profitable in the long run.
Is Bitcoin on the verge of a pullback?
Over the last few weeks, the king of cryptocurrencies hit new yearly highs, with the most recent $16,000. Although many analysts believe that the bull cycle is yet to reach its elastic limit, pullbacks, as it can be seen, are frequent in up-trending markets. Besides, the fear and greed index is currently at extreme greed, suggesting that entering the market now could be a risky idea. With that in mind, traders must learn the best to buy dip strategies.
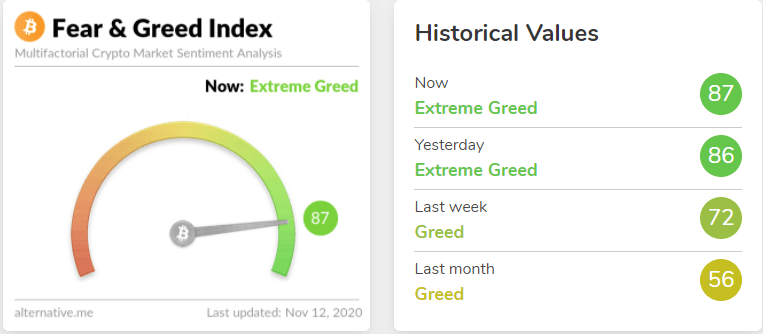
Bitcoin Fear and Greed Index
Buying the dip using moving averages
The two BTC/USD charts clearly show the moving averages present robust support levels where people can start to execute their buy orders. The moving averages also help to foretell the general trend of the market. If the 50-day SMA is moving up with the price above it, this confirms the bullish trend. Some of the moving averages to keep in mind include the 4-hour 50 SMA, the 50-day SMA and the 200-day SMA.
When buying the dip, it is essential to expose yourself by incorporating different moving averages with varying timeframes to get the best out of the strategy. In pullbacks, the price tends to bounce back on approaching the 50-day SMA. However, sliding beneath it, a sharp reversal is needed to validate the reversal. It is worth noting that if the price stays longer under the 50-day SMA, it risks bringing a nasty death cross into the picture.
The TD Sequential indicator on the ETH/USD daily chart also comes up as a formidable buy the dip strategy. Sell signals in red nine candlesticks help to single out the tops, suggesting the best areas to exit the market. The bull market between 2016 and 2018 highlighted multiple local tops and bottoms where buy the dip ideas were validated.
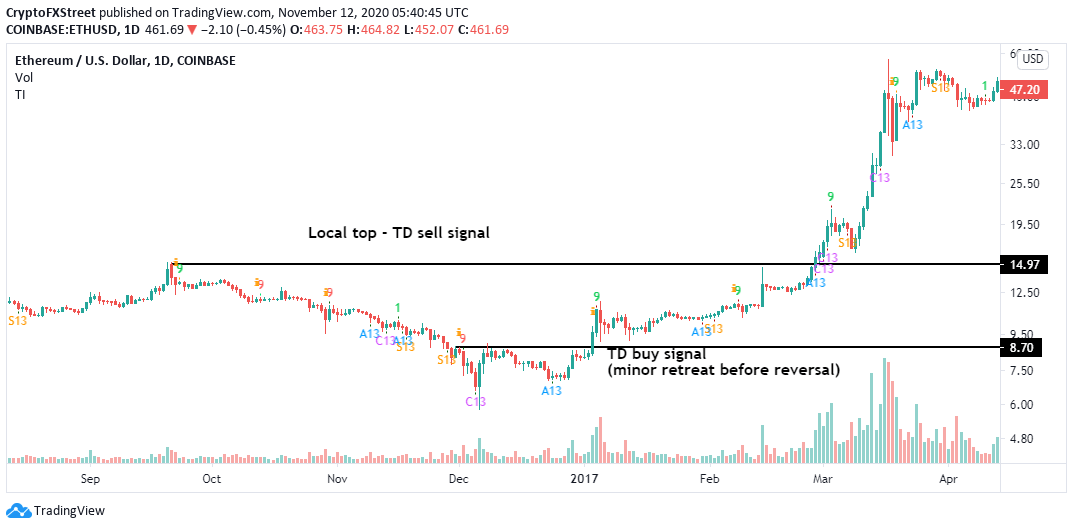
ETH/USD daily chart
On the other hand, when not invalidated, buy signals can be used to identify areas of entry. It is worth mentioning that the TD Sequential indicator should be used with other technical indicators to validate the local tops and bottoms. Moving averages play a vital role by reinforcing resistance and support levels.
Author

John Isige
FXStreet
John Isige is a seasoned cryptocurrency journalist and markets analyst committed to delivering high-quality, actionable insights tailored to traders, investors, and crypto enthusiasts. He enjoys deep dives into emerging Web3 tren


