BTC/USD prepares to test three year highs soon
-
Bitcoin (BTC/USD) is moving up again. Price action was able to find strong support at the 21 ema zone weekly chart. The probability of a bullish wave 3 is now seriously increasing.
-
BTC/USD is testing the resistance Fractal. This is the critical and key level for the bulls. A bullish breakout above the resistance Fractal should spark a strong bullish rally.
-
The best course of action is to wait for a pullback. A bull flag chart pattern would be a welcomed pattern. But also a bullish bounce at the 21 ema zone.

This article reviews the key confirmation level for the bulls. We also look at the second most likely path of least resistance.
Price Charts and Technical Analysis
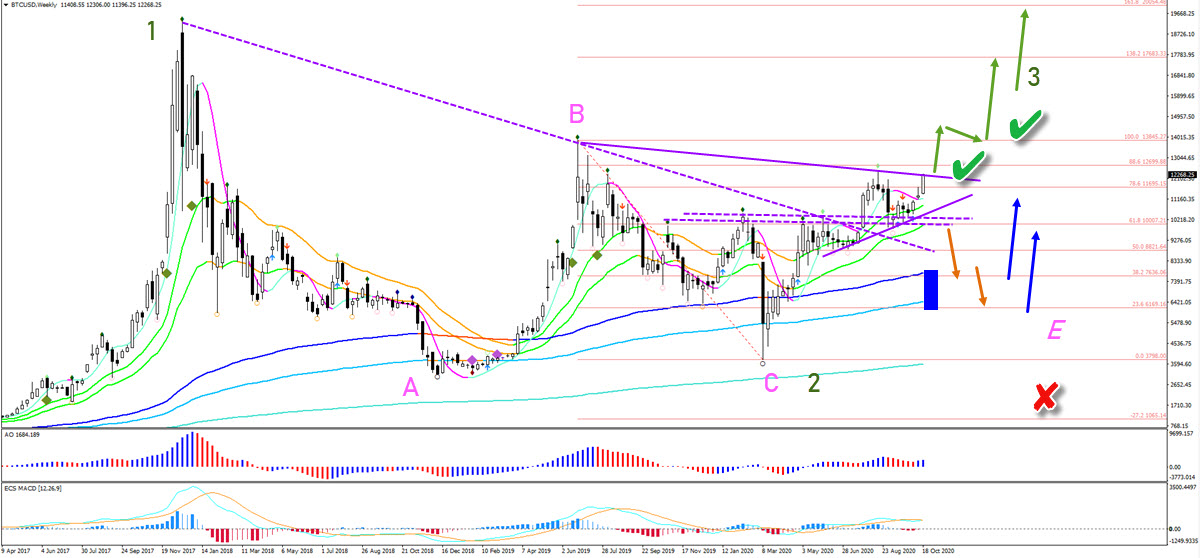
The BTC/USD is testing the resistance Fractal (purple line). This is the critical and key level for the bulls. A bullish breakout above the resistance Fractal should spark a strong bullish rally (green arrows).
Price action has already managed to break above other key resistance levels (dotted purple lines). So this Fractal and 88.6% Fibonacci retracement are the least resistance before the bulls could push for a third wave (green).
Only a break below the 21 ema (orange arrows) could indicate a deeper retracement. In that case, we might see the triangle pattern as we estimated in our previous analysis (wave E pink). But the support zone (blue box) should stop price action from falling too far.
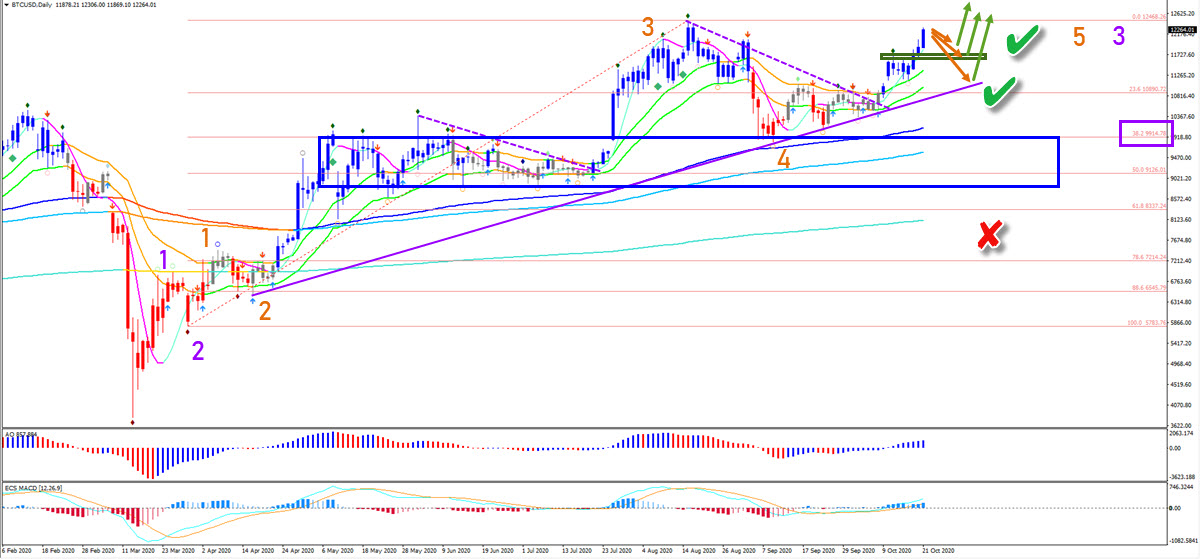
On the daily chart (see below), price action respected the support zone (blue box) and the 38.2% Fibonacci level (purple box). Price has also broken above the resistance trend line (dotted purple).
The breakout above the Fractal (green box) is an extra confirmation that the bulls are in control… BUT price action is now too close to the previous top for any decisive action, in my view.
The best course of action is probably to wait for a pullback (orange arrows). A bull flag chart pattern would be a welcomed pattern. But also a bullish bounce at the support trend line and 21 ema zone too. Price action is developing a wave 3 pattern as long as price action stays above the blue box and avoids the red X.
The analysis has been done with the ecs.SWAT method and ebook.
Author

Chris Svorcik
FS method
Chris Svorcik is a trader, analyst, and educator with over 15 years of experience in financial markets, specializing in moving averages, market structure, and price patterns.


