BTC ETF AUM could surpass Gold, expert says, amid enthusiasm for new investment funds
- Gold’s pain “is like the cherry on top for Bitcoin fans,” Balchunas says, amid euphoria following BTC ETF launches.
- Bitcoin price has nicked $53,000, a level last tested on December 3, 2021.
- Almost $100 million in shorts have been liquidated in the process alongside nearly $12 million in long positions.
/definition-of-etf-21007500.jpg)
In a landmark decision on January 10, the US Securities & Exchange Commission (SEC) approved multiple spot Bitcoin exchange-traded funds (ETFs) in a single go. Almost seven weeks down the line, the theme continues to drive the cryptocurrency market, giving investors the train to ride on as markets prepare for the BTC halving in 52 days.
Also Read: Bitcoin price's next move should manifest once MicroStrategy grows BTC portfolio to 193K tokens
Bitcoin ETF AUM to surpass Gold
Eric Balchunas, an ETF specialist with Bloomberg Intelligence, says that there is a decent chance that the assets under management (AUM) for Bitcoin ETFs could surpass those of Gold ETFs in less than two years.
Gold's Pain is Bitcoin ETFs' Gain in Store of Value Smackdown.. new from me on how gold being in the gutter is like the cherry on top for bitcoin fans who just got to witness the biggest ETF launch ever. Decent chance bitcoin ETFs pass gold ETFs in aum in less than 2yrs w… pic.twitter.com/rXJra1dyhF
— Eric Balchunas (@EricBalchunas) February 26, 2024
This supposition draws from the current lull in the Gold ETF market. According to Balchunas, declines in the price and interest in Gold ETFs is what has come as markets lean toward BTC ETFs. In his opinion, we now have a battle for assets between the two investment products.
It becomes even sweeter as BTC ETFs have managed to amass over $8 billion, according to Balchunas, adding that “[BTC ETFs now command] 40% as much in assets and could surpass Gold in under 24 months.”
JUST IN: #Bitcoin is demonetising Gold ETFs as the 'Store of Value' narratives takes hold.
— Bitcoin Archive (@BTC_Archive) February 26, 2024
Bitcoin ETFs are taking in billions, while Gold ETFs are bleeding assets.
Bloomberg's @EricBalchunas pic.twitter.com/k4SuvcTN22
Evaluating how Bitcoin ETFs continue to haul in cash as investors bail on Gold, Balchunas details that as BTC ETFs took in about $5 billion in net new assets since they started trading on January 11, Gold ETFs have only managed $3.6 billion in outflows with part of it going to the BTC ETFs.
Balchunas deems Bitcoin ETF class “the most successful launch in history by many measures,” acknowledging that they have added competition for Gold. A response by X user @wschweitzer corroborates this conclusion.
I'm old and before Bitcoin was a buyer of Gold and Silver which I still own. When I discovered $BTC I stopped buying Gold and Silver. I think both can exist in a portfolio.
— Walter Schweitzer (@wschweitzer) February 26, 2024
Almost $100 million in short positions liquidated as Bitcoin price breaches $53,000
Bitcoin price has breached the $54,000 milestone, a level last tested on December 3, 2021. The multi-year high has caught many traders off guard as analysts anticipate a correction before the next leg up.
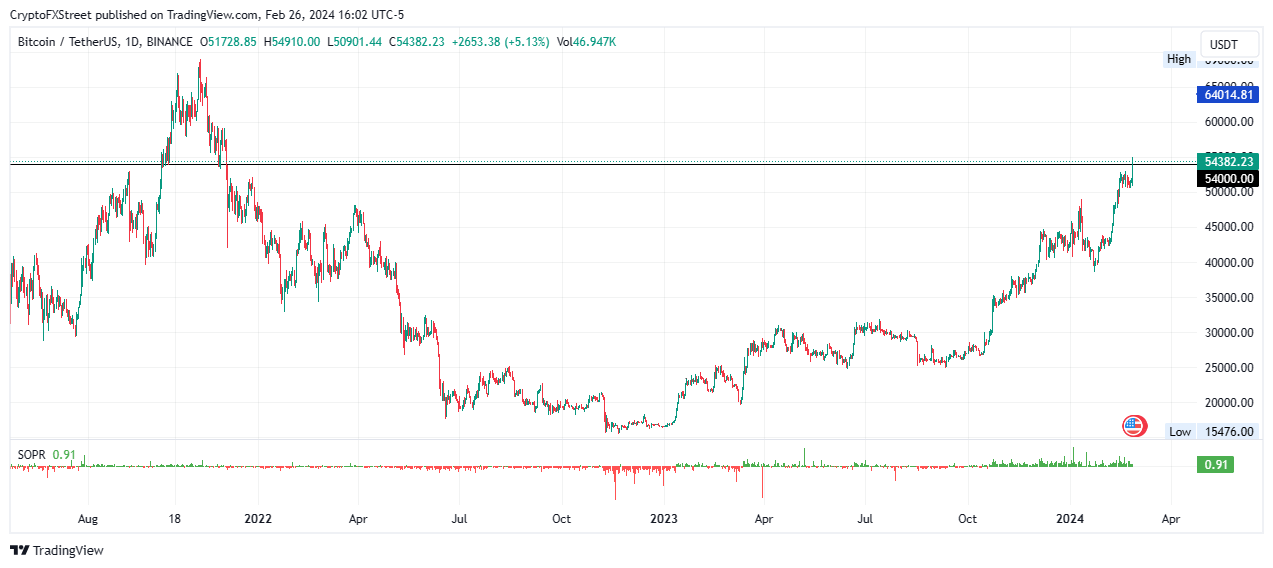
BTC/USDT 1-day chart
Data shows that there are many stop losses around $52,000, which is likely to trigger a foray north in Bitcoin price as shorts close their positions.
#BTC Liquidation Update
— Dieguito - Charts (@DieguitoCharts) February 26, 2024
52k's are full of stops, which can be fuel for higher
I am still LONG from low 50k's, and holding spot position on altcoins also ✅ pic.twitter.com/dTS3Fc2KdM
Nevertheless, with the foray past $54,000, $96.36 million in short positions have been liquidated alongside $11.5 million longs.
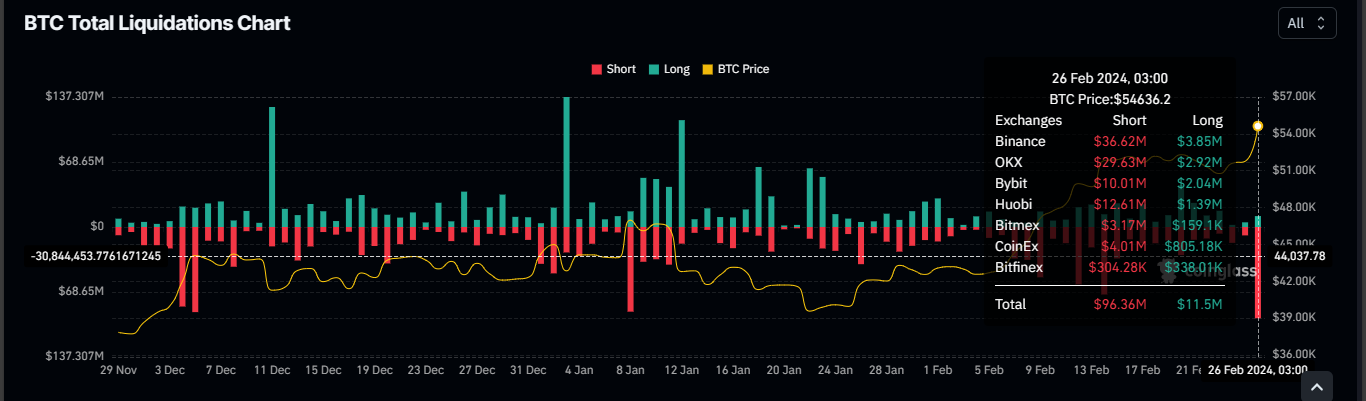
BTC liquidations chart
At the time of writing, Bitcoin price is trading at $54,382 as of 21:00 GMT.
Open Interest, funding rate FAQs
How does Open Interest affect cryptocurrency prices?
Higher Open Interest is associated with higher liquidity and new capital inflow to the market. This is considered the equivalent of increase in efficiency and the ongoing trend continues. When Open Interest decreases, it is considered a sign of liquidation in the market, investors are leaving and the overall demand for an asset is on a decline, fueling a bearish sentiment among investors.
How does Funding rate affect cryptocurrency prices?
Funding fees bridge the difference between spot prices and prices of futures contracts of an asset by increasing liquidation risks faced by traders. A consistently high and positive funding rate implies there is a bullish sentiment among market participants and there is an expectation of a price hike. A consistently negative funding rate for an asset implies a bearish sentiment, indicating that traders expect the cryptocurrency’s price to fall and a bearish trend reversal is likely to occur.
Author

Lockridge Okoth
FXStreet
Lockridge is a believer in the transformative power of crypto and the blockchain industry.


