Breaking: Bitcoin briefly slips below $13,000 for the first time since the last rally
- Bitcoin briefly slips below $13,000, touches $12,891 but recovers slightly.
- The flagship cryptocurrency hits the 2019-high at $13,868 before getting significantly rejected.

After a notable rally from the low of $9,813 established on September 3, Bitcoin managed to reach the 2019-high at $13,868. Unfortunately, the price got rejected heavily and the TD Sequential indicator has presented a sell signal on the 3-day chart.
Can the bulls stop the price from falling further?
The current candlestick formed on the 3-day chart is significantly bearish, especially after the TD sequential indicator presented a sell signal. The 50-SMA is all the way down at $10,600 and the 100-SMA at $9,478, which means they won't help in the short-term.
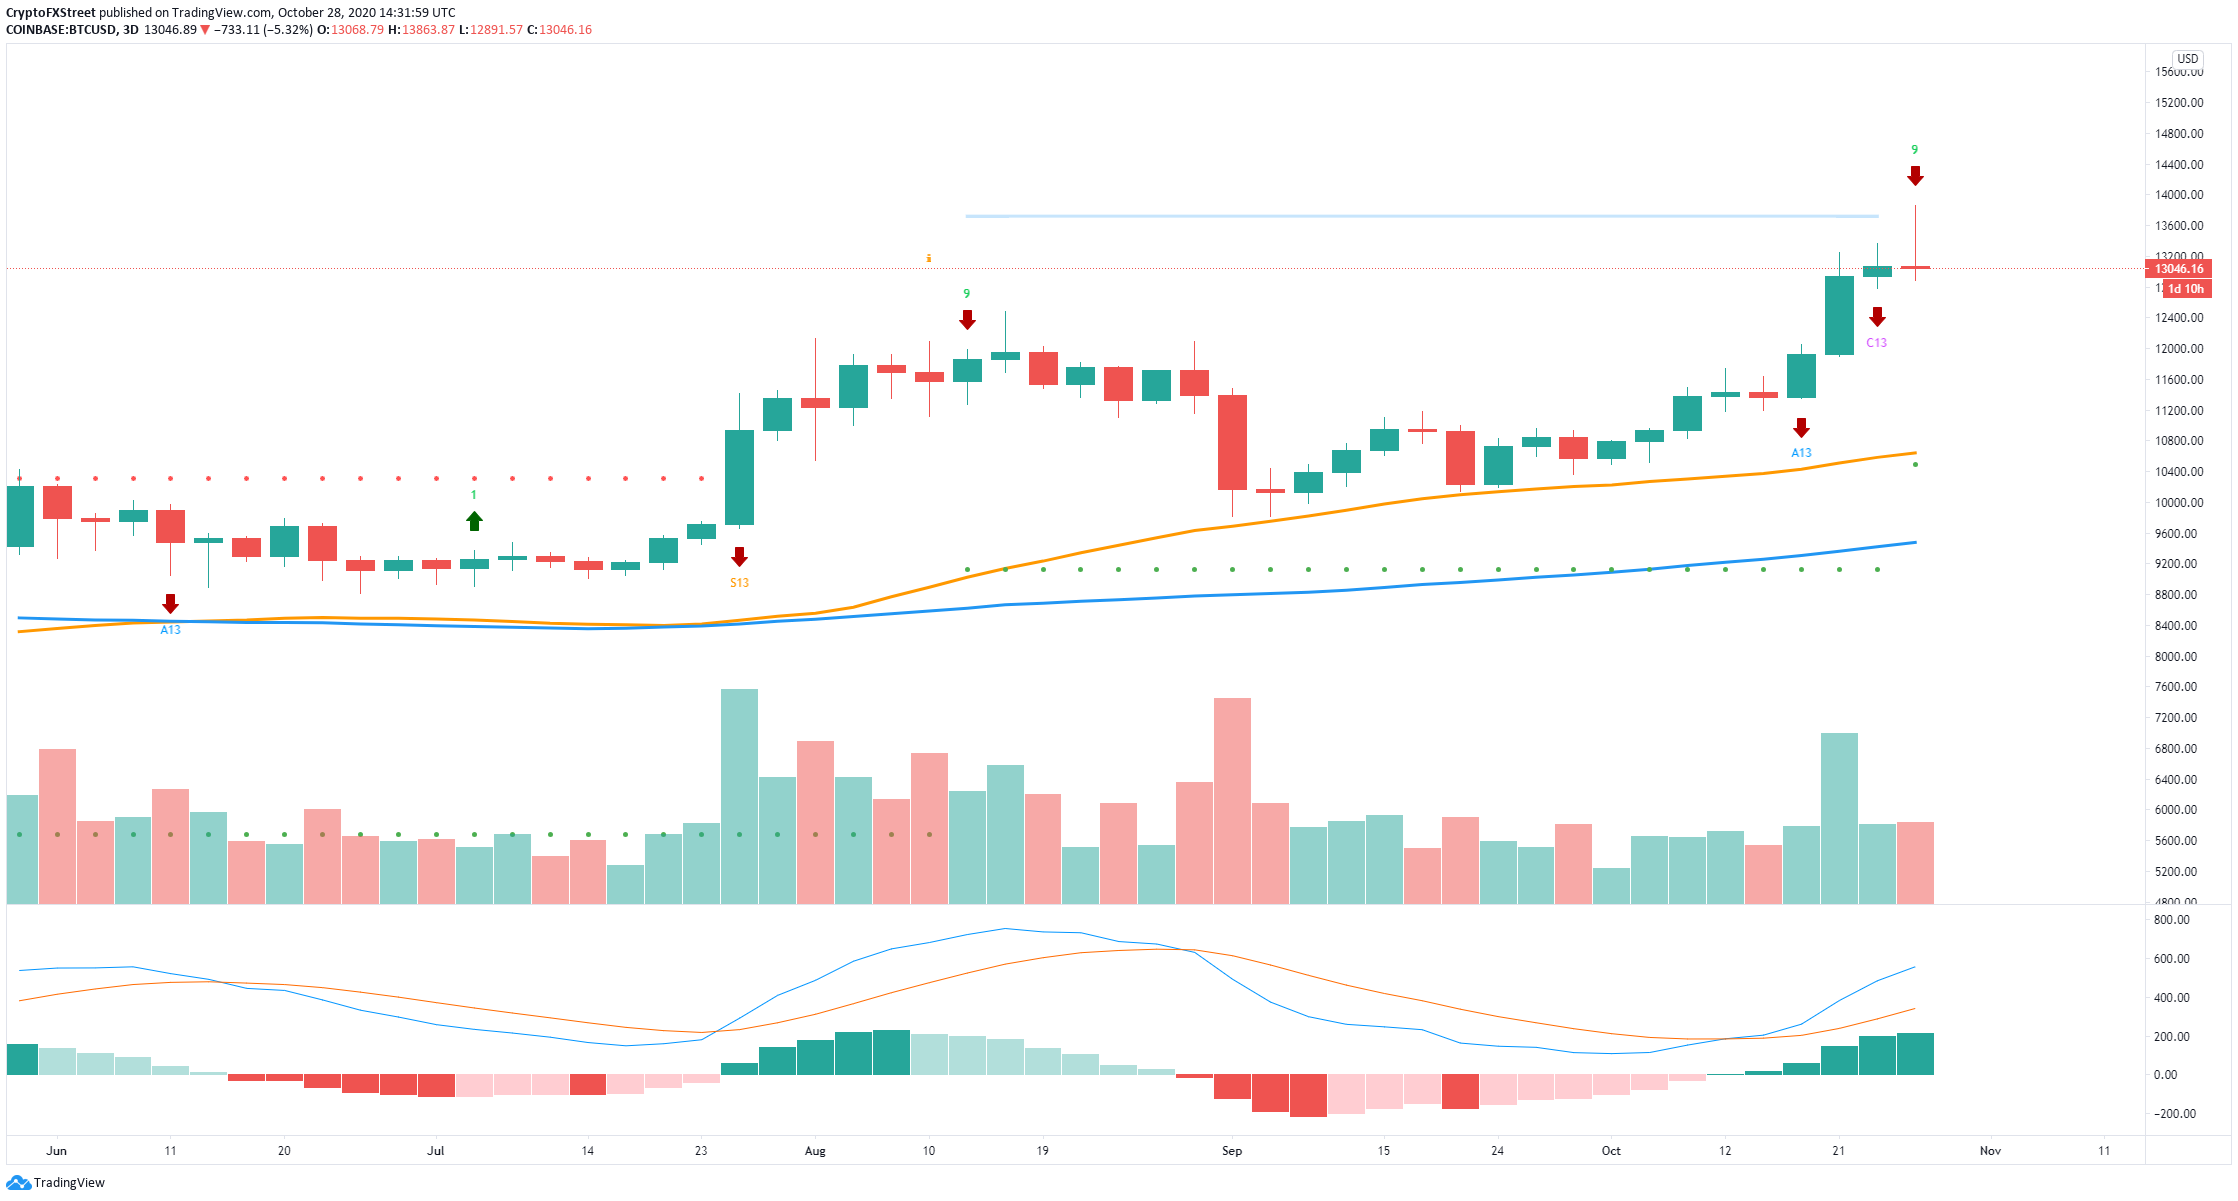
BTC/USD 3-day chart
The In/Out of the Money Around Price chart shows the nearest and strongest support area to be between $12,687 and $13,073 with close to 624,000 BTC in volume. A break below this point can drive the price of Bitcoin down to $11,914.
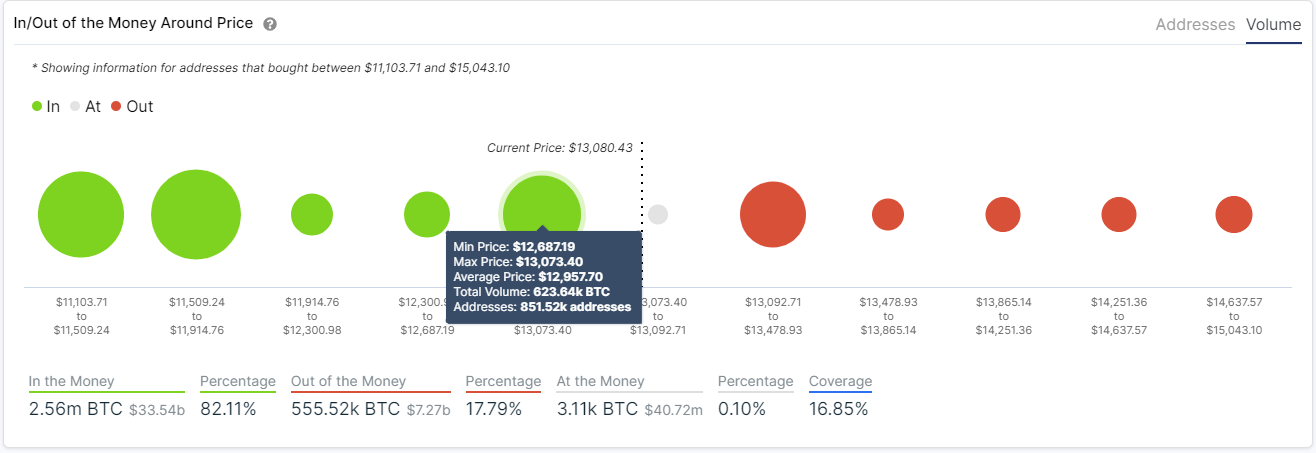
BTC/USD IOMAP chart
Bitcoin daily uptrend remains intact despite bearish action
Although bears seem to have taken control over the short-term, the robust daily uptrend remains intact for Bitcoin. The 50-SMA and the 100-SMA coincide around $11,200 which will act as a significant support level. The MACD keeps bullish and the most critical resistance level is still at $13,863. A breakout above this point can easily drive the flagship cryptocurrency towards the all-time high at $20,000.
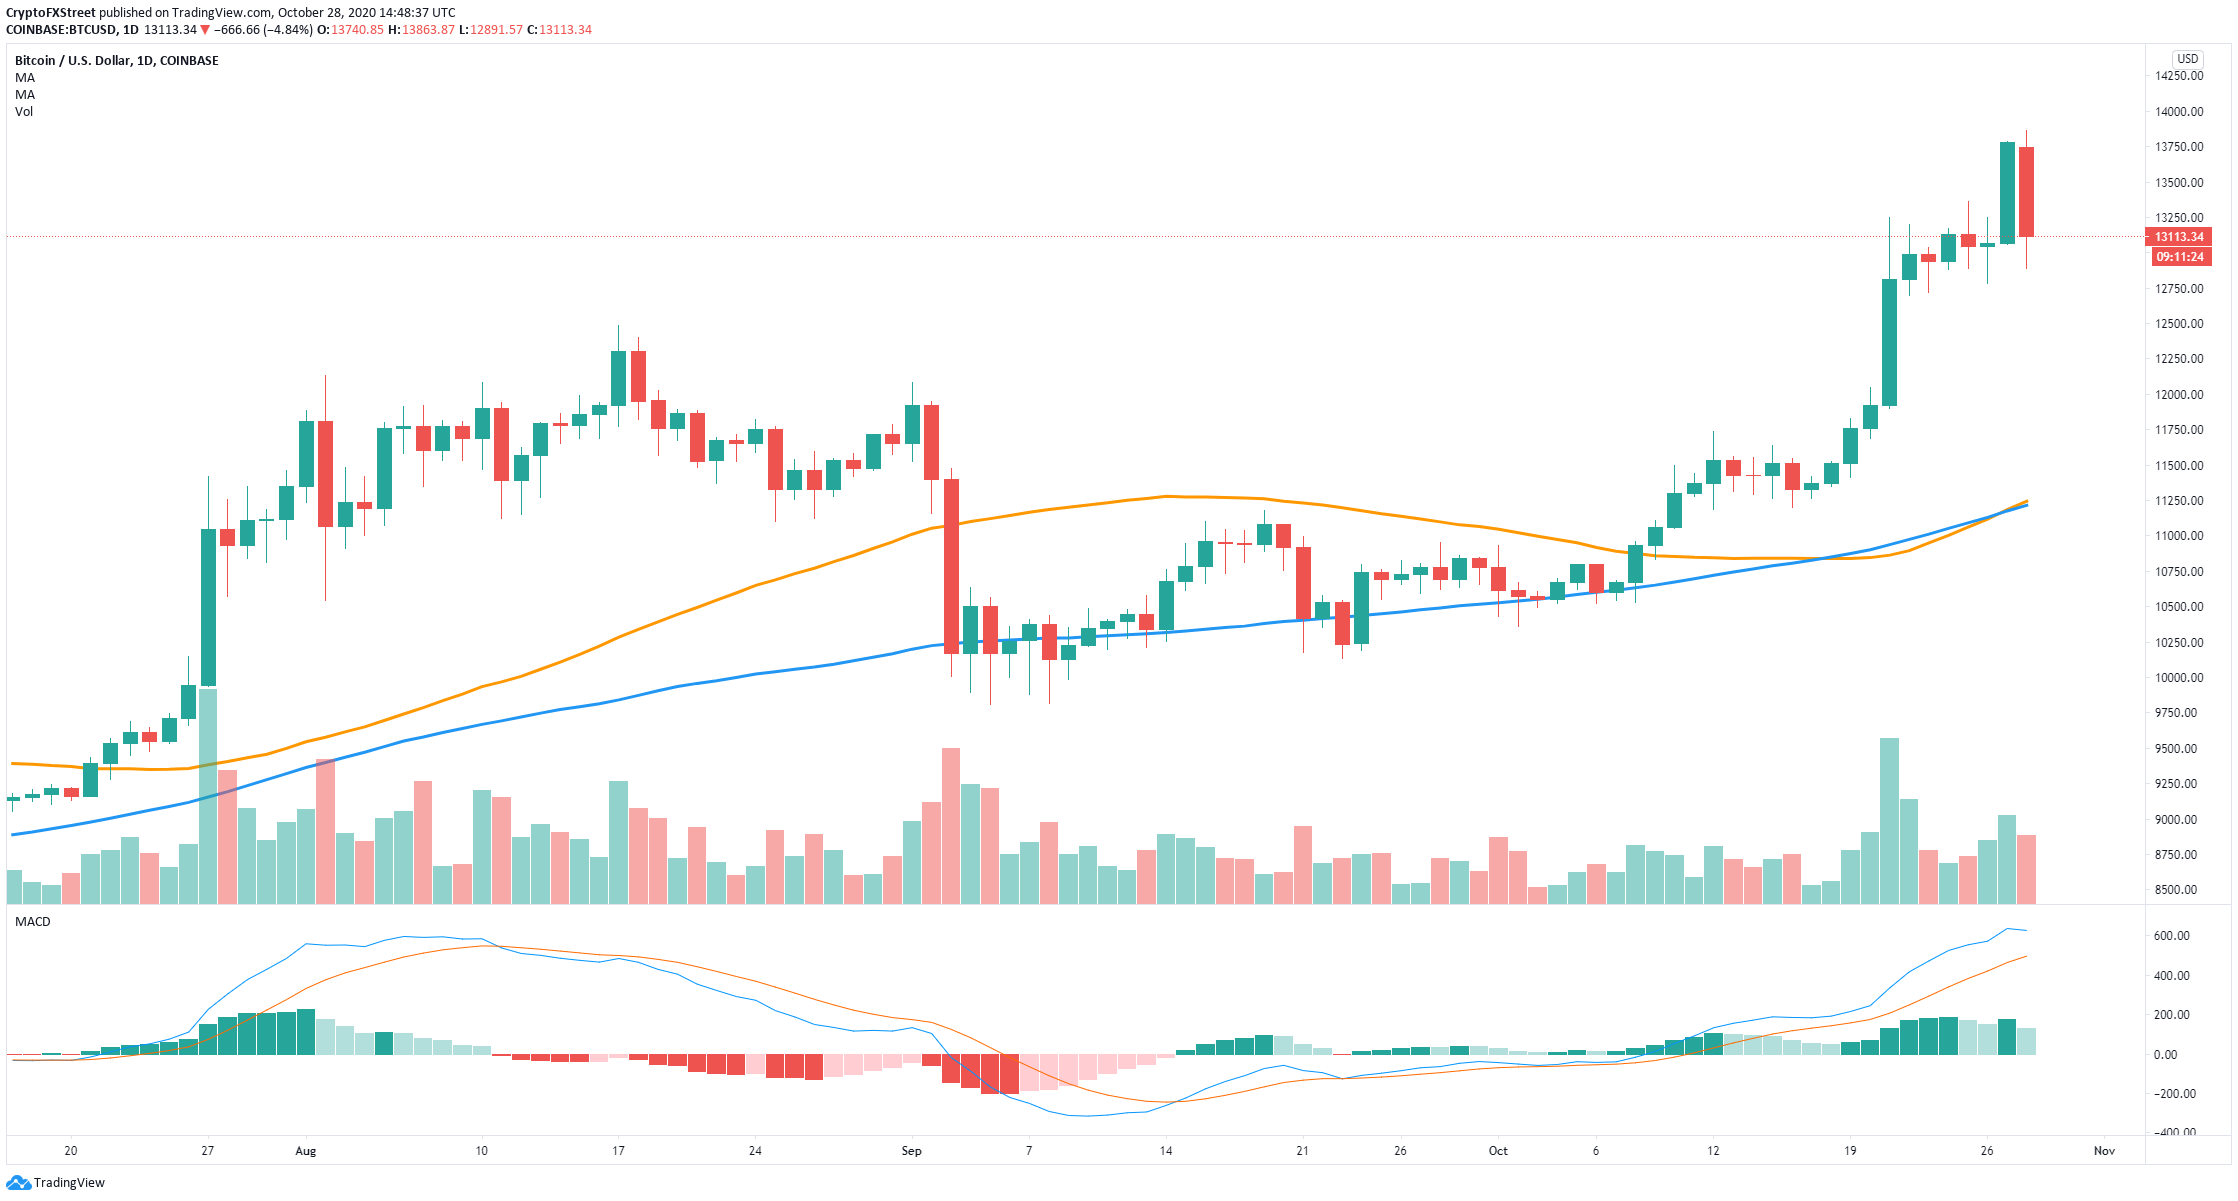
BTC/USD daily chart
Author

Lorenzo Stroe
Independent Analyst
Lorenzo is an experienced Technical Analyst and Content Writer who has been working in the cryptocurrency industry since 2012. He also has a passion for trading.


