Share:
  • Shiba Inu price decline exceeds measured move target in a day of panic selling.
  • 110% rebound from the low quickly stalls at critical moving average.
  • SHIB just fell below symmetrical triangle’s lower trend line.

Shiba Inu price fell 59% from the descending triangle pattern trigger price in less than two days, pushing SHIB well below the measured move target of $0.00000966. Current price action dictates a test of the lows in the coming days.

Shiba Inu price fails to resist wave of selling

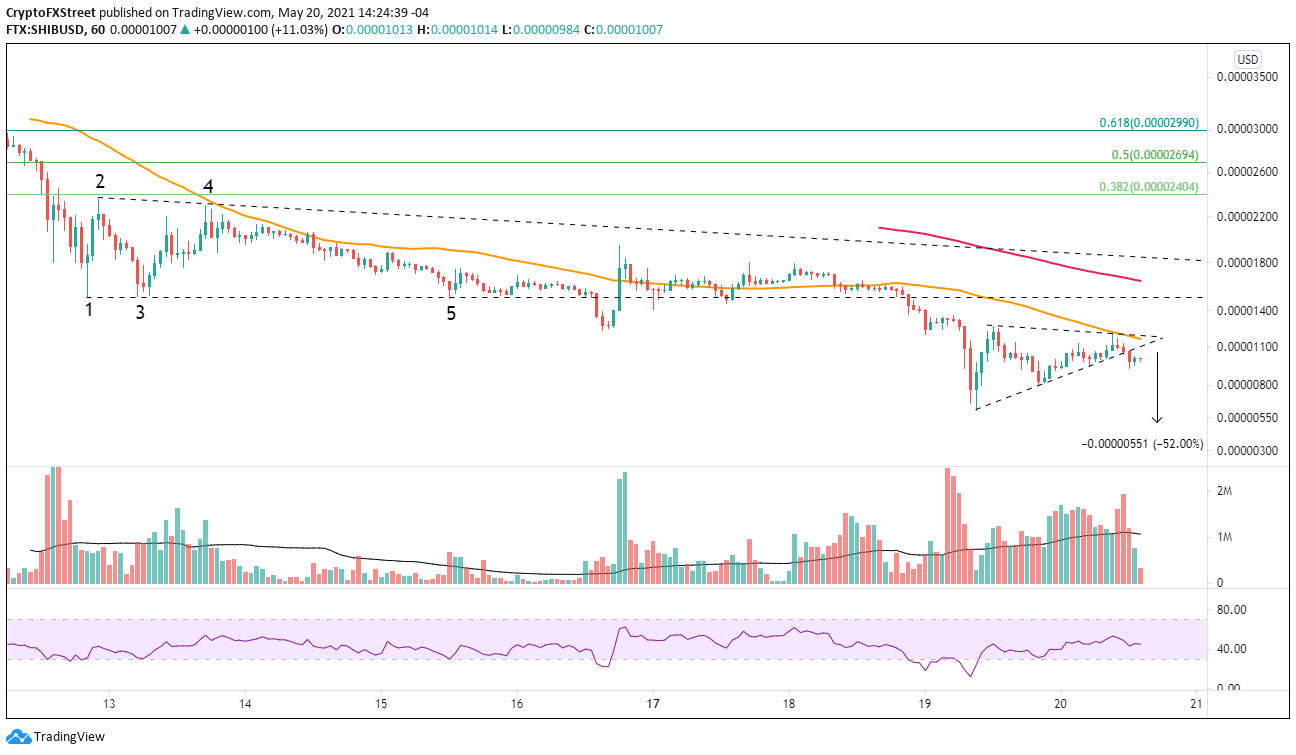
Beginning May 12, Shiba Inu price defined a descending triangle pattern on the 1-hour chart with a measured move target of $0.00000966, representing a 36% decline. The pattern included two reaction highs and two reaction lows, and the volume was muted through most pattern development. 

Shiba Inu price initially broke below the triangle’s lower trend line on May 16 before rebounding to the middle of the triangle, where it fell into a new consolidation before breaking down again on May 18. SHIB fell 59% from the trigger price before commanding some buying interest. The ensuing rally lifted the digital token 110% in a matter of hours.

Since the notable rebound, Shiba Inu has shaped a symmetrical triangle pattern just below the 50 one-hour simple moving average. At the time of writing, SHIB has declined below the triangle’s lower trend line. The measured move target of the triangle is $0.00000508, or a 52% decline from the triangle’s trigger price, taking SHIB below yesterday’s low of $0.00000607.

An extension of today’s rebound in the cryptocurrency complex or a bullish take on SHIB in the social media could void the short-term bearish outlook for Shiba Inu price and carry it back to the descending triangle’s lower trend line at $0.00001510.

SHIB/USD 1-hour chart

If Shiba Inu price does attract a bid, the first resistance will be the 50 one-hour simple moving average (SMA) at $0.00001168 and then the descending triangle’s lower trend line at $$0.00001510. A bullish thrust above the trend line would soon find more resistance at the 200 one-hour moving average at $0.00001168.


Note: All information on this page is subject to change. The use of this website constitutes acceptance of our user agreement. Please read our privacy policy and legal disclaimer. Opinions expressed at FXstreet.com are those of the individual authors and do not necessarily represent the opinion of FXstreet.com or its management. Risk Disclosure: Trading foreign exchange on margin carries a high level of risk, and may not be suitable for all investors. The high degree of leverage can work against you as well as for you. Before deciding to invest in foreign exchange you should carefully consider your investment objectives, level of experience, and risk appetite. The possibility exists that you could sustain a loss of some or all of your initial investment and therefore you should not invest money that you cannot afford to lose. You should be aware of all the risks associated with foreign exchange trading, and seek advice from an independent financial advisor if you have any doubts.

Join Telegram

Follow us on Telegram

Stay updated of all the news

Join Telegram

Recommended content


Follow us on Telegram

Stay updated of all the news

Join Telegram

Recommended Content

Editors’ Picks

Three altcoins that have kickstarted Q4 rally: LINK, RDNT, FLOKI

Three altcoins that have kickstarted Q4 rally: LINK, RDNT, FLOKI

Chainlink price has been on a tear for the last two weeks and has the potential for more upside. Radiant Capital price has breached a falling wedge and shows promise of further ascent. 

More Cryptocurrencies News

Week ahead: Fed speech and NFP likely to dictate crypto market moves this week

Week ahead: Fed speech and NFP likely to dictate crypto market moves this week

With the start of 2023’s fourth quarter, things are finally getting interesting in crypto. While the next 12 weeks are extremely important, let’s start by focusing on what to expect this week.

More Cryptocurrencies News

DOT confirms trend reversal, eyes retest of $5 after reclaiming key hurdle

DOT confirms trend reversal, eyes retest of $5 after reclaiming key hurdle

Polkadot price trades inside a tight range above a critical support level of $3.98. The daily RSI produced a higher high, signaling a surge in bullish momentum and a potential breakout scenario. 

More Polkadot News

FLOKI sets stage for 30% rally

FLOKI sets stage for 30% rally

Floki Inu (FLOKI) price has triggered a quick but explosive uptrend in the last 24 hours. The uptrend has pushed the meme coin above a key hurdle and could assist FLOKI bulls in reversing the downtrend. 

More Floki Inu News

Bitcoin: BTC recovery rally could be bull trap in disguise, here’s why

Bitcoin: BTC recovery rally could be bull trap in disguise, here’s why

Bitcoin (BTC) price remains unfazed even after the multiple spot BTC ETF delays from the US Securities & Exchange Commission (SEC). But investors need to be careful with the ongoing BTC rally as it could be a trap for early bulls.

Read full analysis

BTC

ETH

XRP