Book of Meme poised for 20% rally
- Book of Meme price is retesting its daily resistance at $0.0108; a close above it signals a bullish move.
- On-chain data suggests that BOME's Open Interest is rising, signaling positive sentiment among investors.
- A daily candlestick close below $0.0063 would invalidate the bullish thesis.

Book of Meme (BOME) price is currently retesting its daily resistance at $0.0108 on Tuesday, and a close above this level could signal a bullish move. On-chain data indicates a rising Open Interest for BOME, reflecting positive investor sentiment and suggesting a potential rally in the coming days.
Book of Meme price sets for a rally after break above daily resistance level
The Book of Meme price retraced last week to test its daily support at $0.00791, coinciding with the ascending trendline on Friday. Subsequently, it surged by 19% over the next three days. As of Tuesday, the previous daily resistance level is challenging at $0.0108, with BOME’s current price showing a 9.2% daily increase at $0.0011.
If BOME closes above the $0.0108 daily resistance, it could rally 20% to retest its weekly resistance at $0.0130.
On the daily chart, the Relative Strength Index (RSI) and the Awesome Oscillator (AO) indicators are trading above their neutral levels of 50 and zero, respectively. This robust momentum signals a strong bullish sentiment in the market.
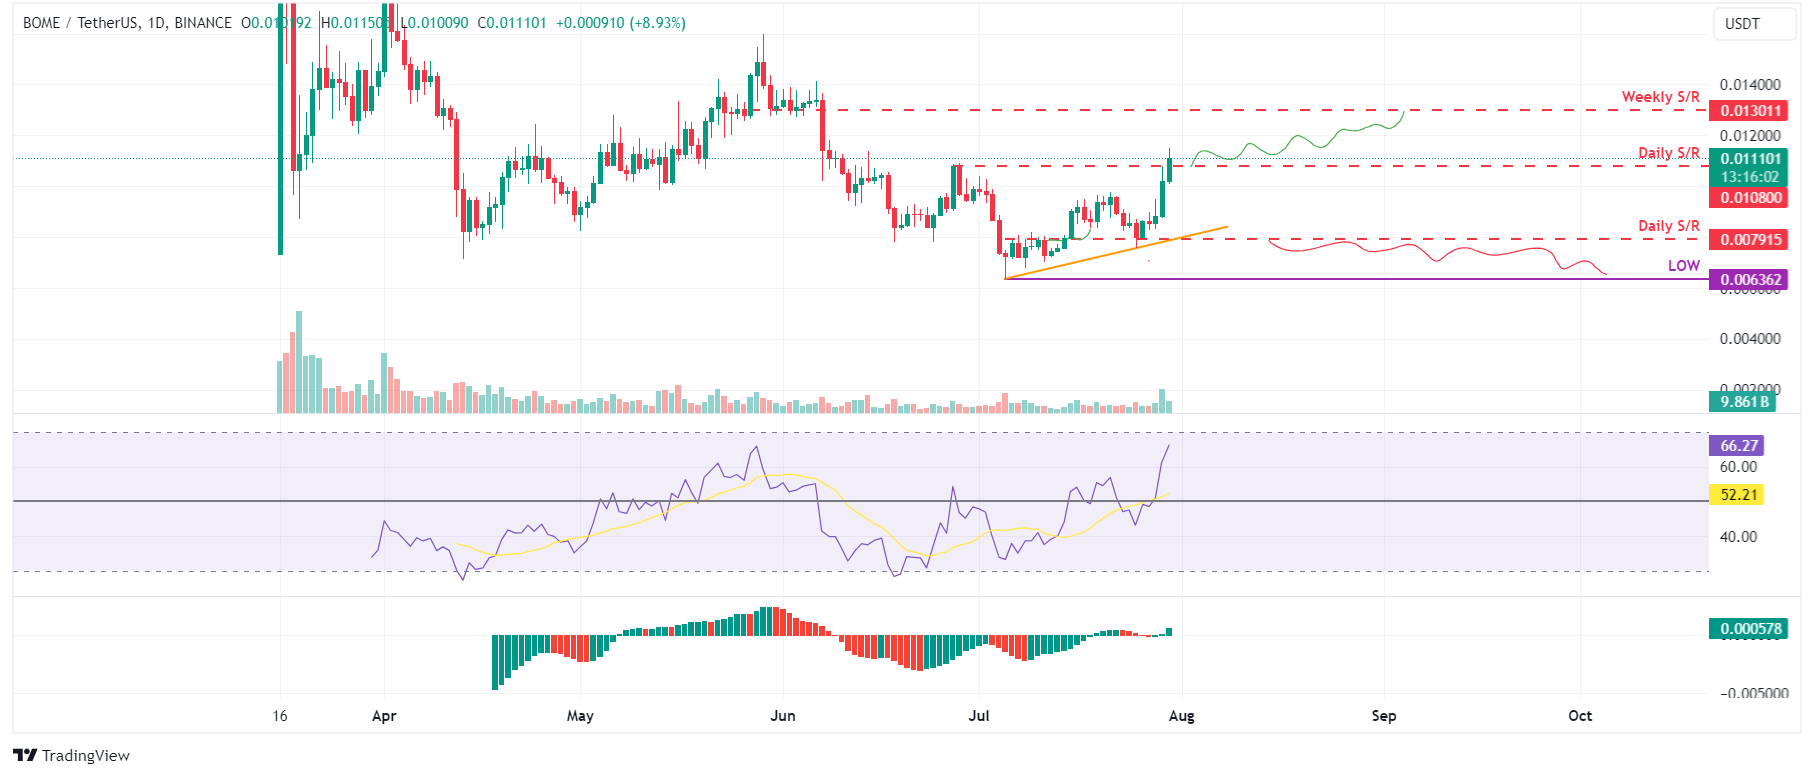
BOME/USDT daily chart
Data from CoinGlass shows that the future's Open Interest (OI) in BOME at exchanges is increasing. The OI indicates the total number of outstanding derivative contracts that have not been settled (offset by delivery) and whether money flows into the contract are increasing or decreasing.
Increasing OI represents new or additional money coming into the market and new buying happening, which suggests a bullish trend. When OI decreases, it is usually a sign that the market is liquidating, more investors are leaving, and the current price trend is ending.
The graph below shows that BOME's OI increased from $61.88 million on Saturday to $104.80 million on Monday, indicating that new or additional money is entering the market and new buying is occurring.
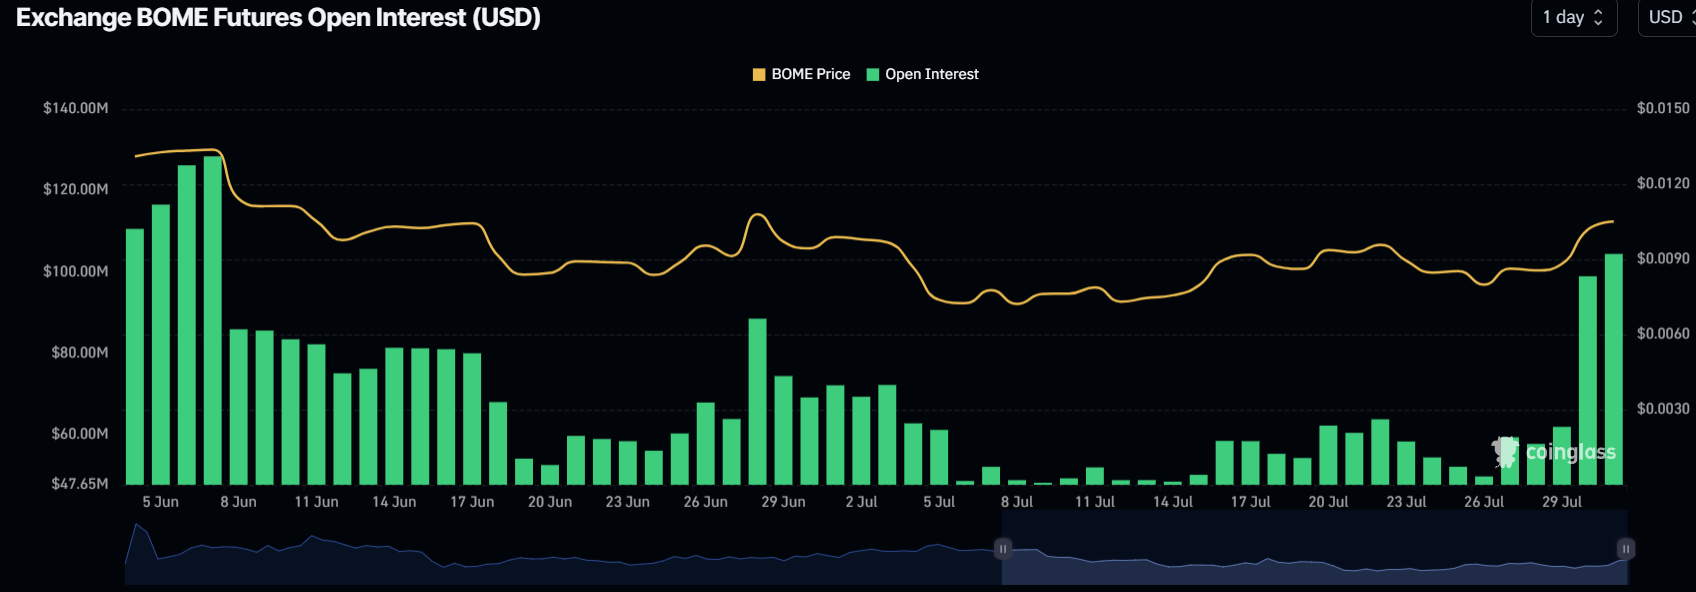
BOME Open Interest chart
Even though the on-chain metric and technical analysis point to a bullish outlook, if BOME's daily candlestick closes below $0.0079, the daily support area, the bullish thesis would be invalidated by producing a lower low on the daily timeframe. This development may trigger an 20% crash in Book of Meme's price to revisit the July 5 low of $0.0063.
Author

Manish Chhetri
FXStreet
Manish Chhetri is a crypto specialist with over four years of experience in the cryptocurrency industry.


