BOME Price Forecast: Poised for a rally as technicals show bullish divergences
- Book of Meme price finds around the key level at $0.0071, with an impending rally eyed.
- The RSI and AO indicators formed bullish divergences, signaling a reversal.
- A daily candlestick close below $0.0071 would invalidate the bullish thesis.

Book of Meme (BOME) price has stabilized near the critical level of $0.0071. The Relative Strength Index (RSI) and the Awesome Oscillator (AO) indicators have shown a bullish divergence, indicating a likely reversal and upward movement in the days ahead.
Book of Meme price action shows a bullish indication
Book of Meme price found support around $0.0071, the low of April 13 on Monday. It bounced 3% and trades at $0.0078 on Wednesday.
Additionally, on the daily chart, the formation of a lower low on July 5 contrasts with the Relative Strength Index's (RSI) higher highs during the same period. This development is termed a bullish divergence and often leads to the reversal of the trend or a short-term rally.
If this support level at $0.0071 holds, BOME could rise 7% to retest its daily resistance level at $0.0083.
Moreover, if BOME closes above $0.0083, it could extend an additional 23% rally to retest its daily high of $0.0103 from July 1.
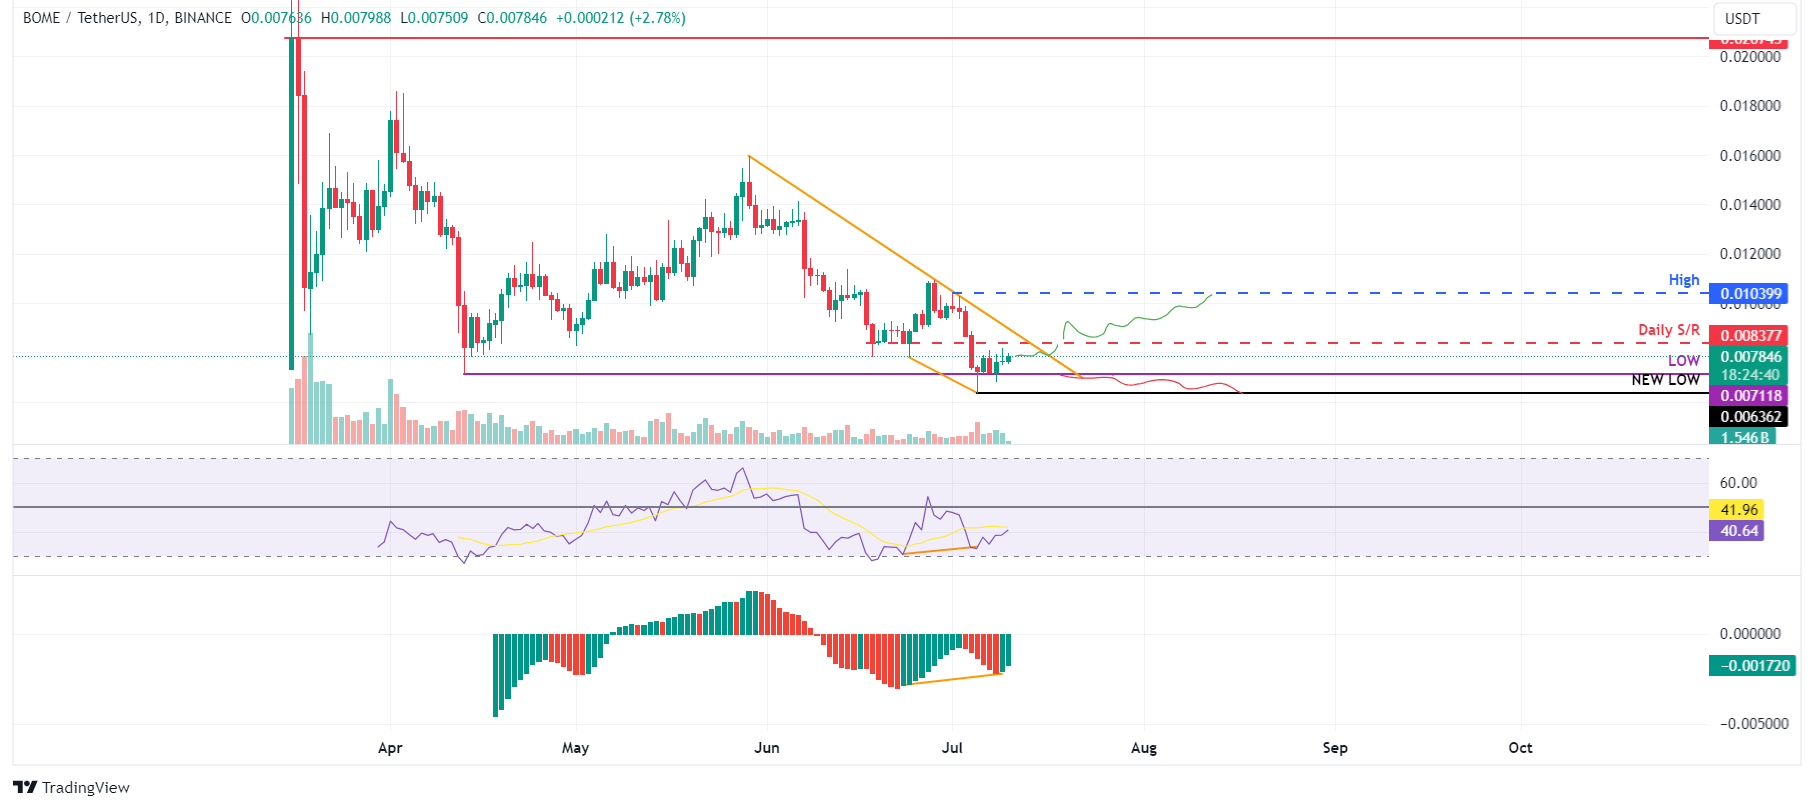
BOME/USDT daily chart
However, if the Book of Meme price produces a daily candlestick close below $0.0071, it would produce a lower daily low, potentially signaling a shift to bearish market conditions. This change in market structure would nullify the bullish outlook, triggering an 11% decline in BOME price as it revisits its recent daily low of $0.0063 observed on July 5.
Author

Manish Chhetri
FXStreet
Manish Chhetri is a crypto specialist with over four years of experience in the cryptocurrency industry.


