BNB Price Forecast: Shows signs of weakness as development activity reaches its lowest level in four months
- BNB’s price faces rejection from its previously broken ascending trendline, hinting at a downturn ahead.
- The technical outlook suggests a bearish move as its momentum indicators show weakness.
- Santiment’s data shows that BNB’s development activity reached its lowest level in four months, reflecting waning confidence in its blockchain projects.

BNB (BNB) faces rejection from its previously broken ascending trendline around $686 on Wednesday, hinting at a downturn ahead. The technical outlook suggests a bearish move as its momentum indicators show weakness. Moreover, Santiment’s data shows that BNB’s development activity reached its lowest level in four months, reflecting waning confidence in its blockchain projects.
BNB price faces resistance around the previously broken ascending trendline
BNB’s price broke below its ascending trendline (drawn by connecting multiple lows since early August 2024) on Sunday and declined 2.7% that day. However, it has risen and faced rejection around its broken trendline multiple times since Monday. At the time of writing on Wednesday, it again faces resistance around the trendline level of around $686.17, which coincides with the 50-day Exponential Moving Average.
If the previously broken trendline holds as resistance, BNB’s price could extend the decline to retest its daily support at $612.50.
The Relative Strength Index (RSI) on the daily chart reads 43, below its neutral level of 50 and points downwards, indicating increasing bearish momentum. The Moving Average Convergence Divergence (MACD) indicator also shows a bearish crossover, suggesting a sell signal and a downtrend.
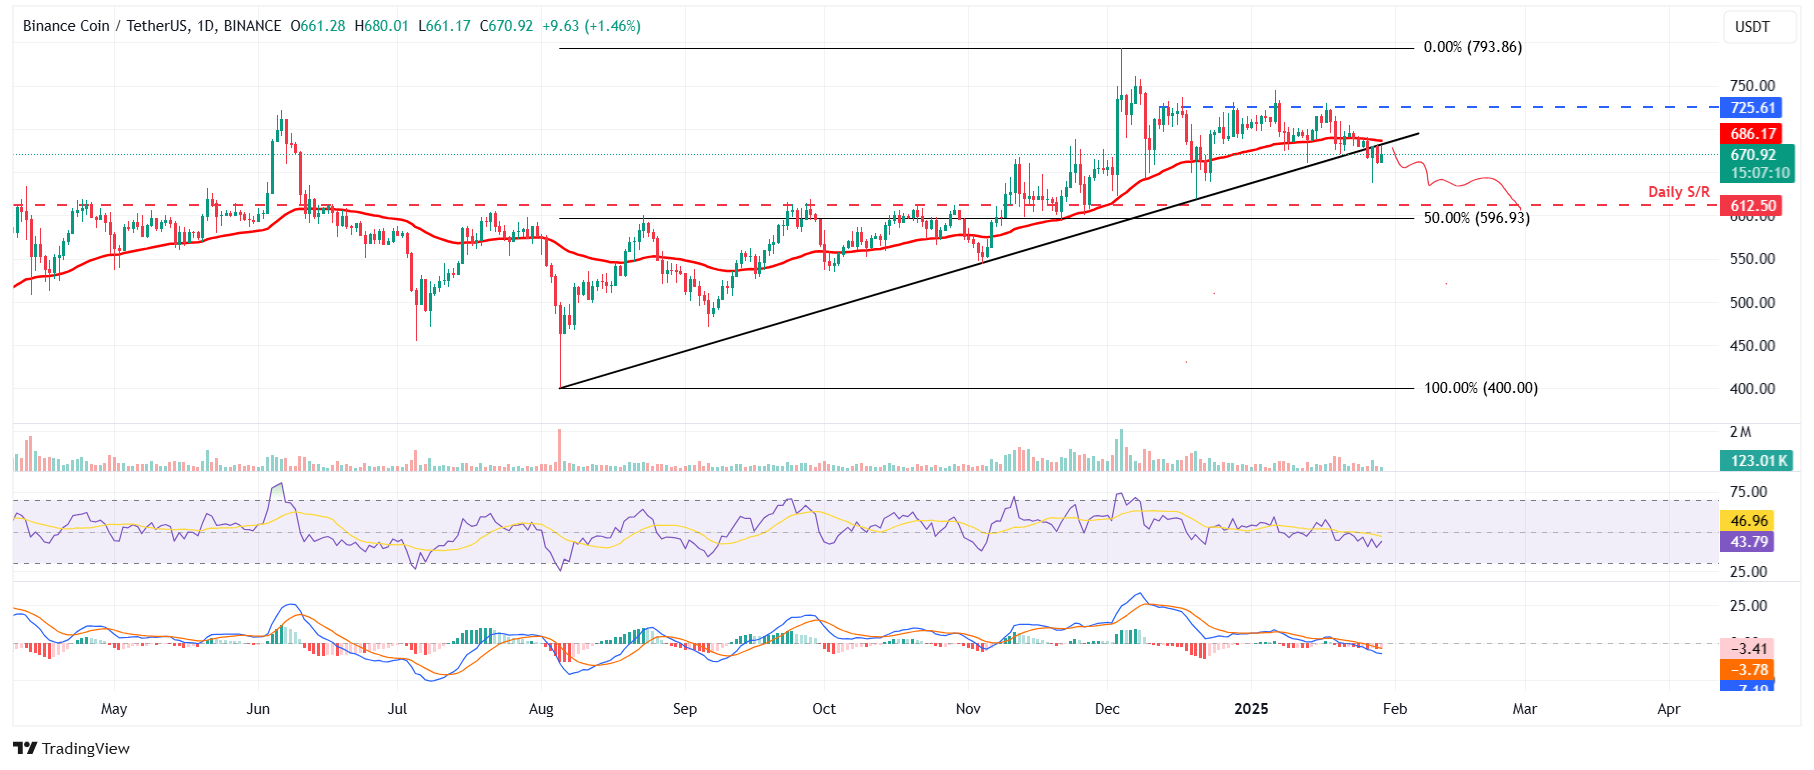
BNB/USDT daily chart
Moreover, Santiment’s Development Activity Index shows project development activity over time based on several pure development-related events in the project’s public GitHub repository.
In BNB’s case, the index sharply fell from 40.43 on January 19 to 20.5 on Wednesday. This trend has been falling since early January and reflects waning confidence in its blockchain projects, which, in turn, undermines investor trust and reinforces the negative market sentiment.
%20[14.19.21,%2029%20Jan,%202025]-638737422324886852.png)
BNB Development Activity chart. Source: Santiment
Author

Manish Chhetri
FXStreet
Manish Chhetri is a crypto specialist with over four years of experience in the cryptocurrency industry.


