Altcoins BNB and Avalanche Price Prediction: BNB and AVAX show weakness as Trump takes the Oval Office
- BNB price edges slightly lower on Tuesday after correcting almost 6% in the last three days.
- AVAX price continues its pullback on Tuesday after declining more than 13% since Saturday.
- Traders should be cautious as both altcoins show signs of weakness in momentum indicators.

Altcoins BNB (BNB) and Avalanche (AVAX) continue to trade down on Tuesday after declining 6% and 13%, respectively, since Saturday. Furthermore, the technical outlook also supports a bearish trend as both altcoins show signs of weakness in momentum indicators.
BNB Price Forecast: Poised for a correction ahead
BNB’s price faced a pullback around the $725.61 resistance level on Saturday, declining 5.6% until Monday. On Tuesday, BNB approaches its ascending trendline (drawn by connecting multiple lows since early August 2024) and trades around $681.
Suppose BNB breaks below the ascending trendline and closes below the 200-day Exponential Moving Average (EMA) at $662.15. It would extend the decline by 9.58% from its current levels to retest its daily support at $612.50.
The Relative Strength Index (RSI) on the daily chart reads 44, below its neutral level of 50 and points downwards, indicating strong bearish momentum. The Moving Average Convergence Divergence (MACD) indicator also shows a bearish crossover on Sunday, suggesting a sell signal and a downtrend.
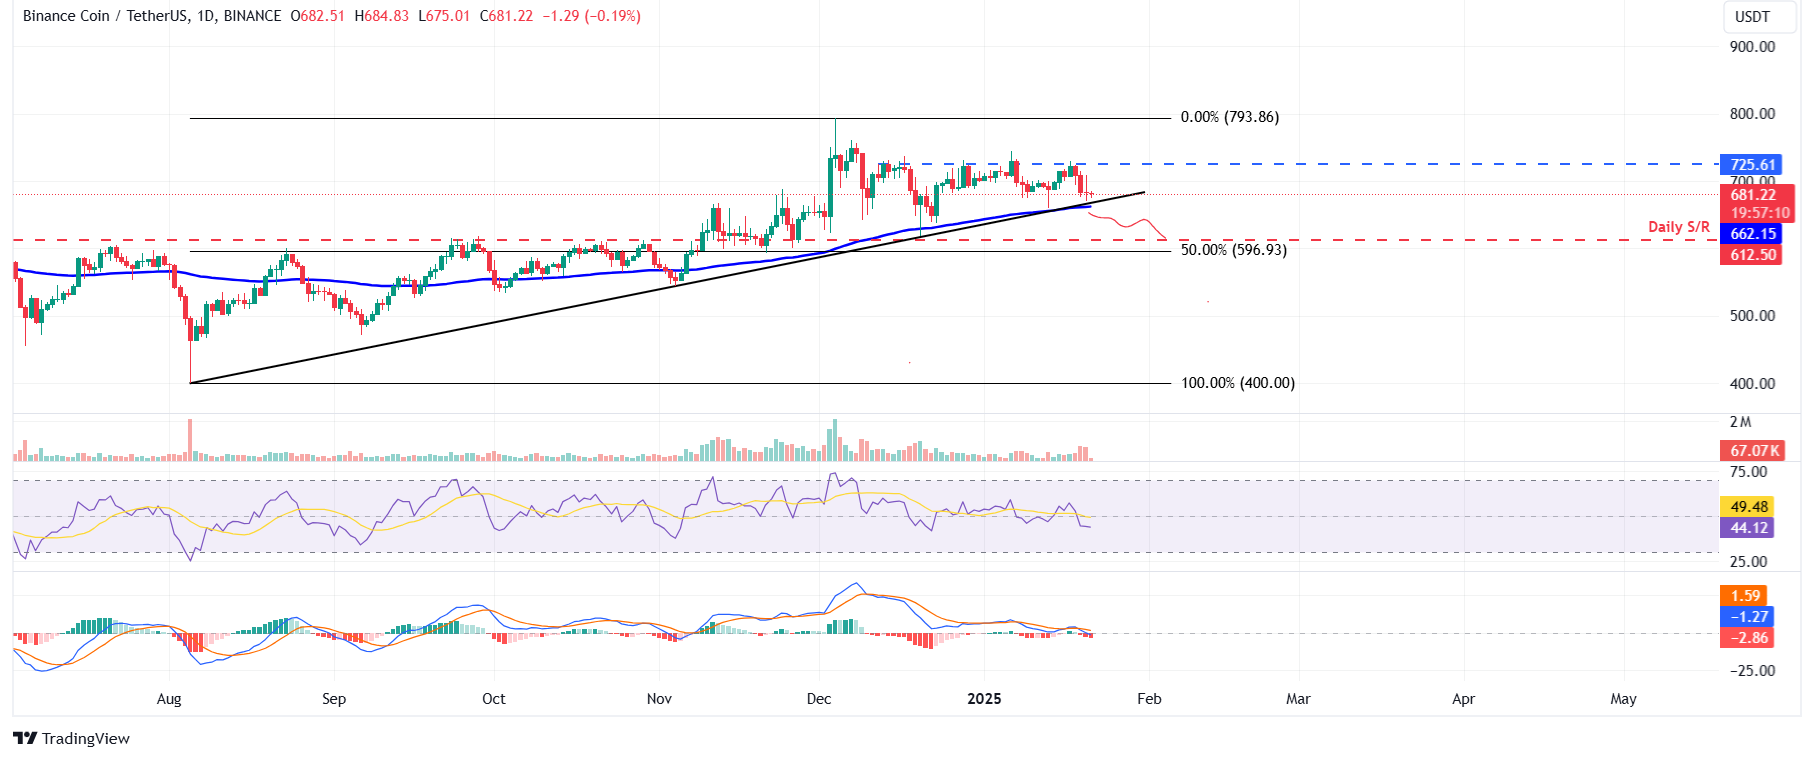
BNB/USDT daily chart
Avalanche Price Forecast: AVAX shows signs of weakness
Avalanche’s price faced rejection around its weekly resistance level at $41.15 on Saturday and declined 13.53% until Sunday, closing below its 200-day EMA at $37.29. At the time of writing on Tuesday, it continues to edge down, trading around $35.05.
If AVAX continues its pullback, it could extend the decline by 8.5% from its current levels to retest its 61.8% Fibonacci retracement level at $32 (drawn from the August low of $17.29 to December high of $55.79).
Like BNB, Avalanche’s RSI indicator trades below its neutral level of 50 and points downwards, indicating strong bearish momentum. Moreover, the MACD shows a bearish crossover on Monday, suggesting a downward trend.
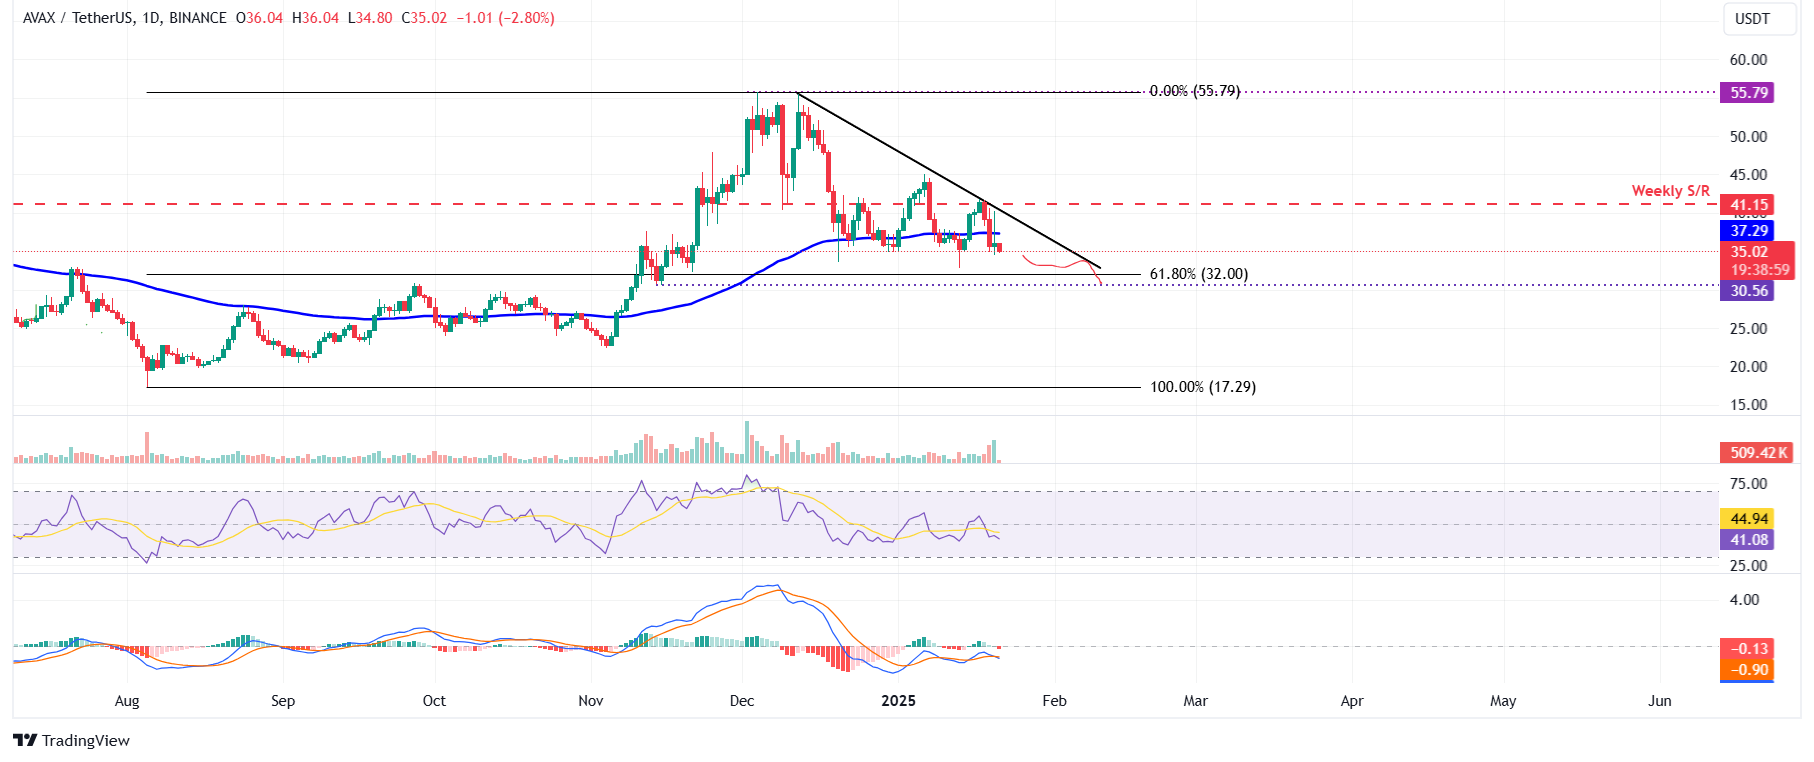
AVAX/USDT daily chart
Author

Manish Chhetri
FXStreet
Manish Chhetri is a crypto specialist with over four years of experience in the cryptocurrency industry.