BNB price could rally 30% with a bullish technical formation in play as Binance hints at a possible breakout
- Binance Coin price action since December 25 has culminated in a flag pattern, which is a continuation technical formation.
- BNB could rally 30% to $414.70 if the price breaks out in the direction of the prevailing trend.
- The bullish thesis will be invalidated upon a decisive daily candlestick close below the lower boundary of the flag at $301.10.
Binance Coin (BNB) price appears poised for a strong move as the broader market prepares for the US Securities and Exchange Commission (SEC) to approve some, if not all the spot Bitcoin exchange-traded funds (ETFs) filings.
Also Read: Binance Coin Price Forecast: BNB buying opportunity before $400
Binance Coin movement hints at an impending breakout in BNB price
Binance Coin (BNB) price could rally soon, following in the prevailing trend among altcoins as this sector of cryptocurrencies trades in the green because of spot Bitcoin exchange-traded funds (ETFs) related hype.
With trading volume up 25%, BNB price appears poised for a move north, accentuated by a recent post on X from Binance exchange official account on the giant social media platform.
— Binance (@binance) January 2, 2024
₿
From a technical standpoint, the BNB price has 30% upside potential in the execution of a bullish technical formation.
In a recent development, the largest cryptocurrency platform on trading volume metrics has launched a new batch of dual investment products with updated target prices and settlement dates. This development allows users to leverage the platform’s ‘Sell High or Buy Low products’
#Binance has launched a new batch of Dual Investment products with updated Target Prices and Settlement Dates.
— Binance (@binance) January 2, 2024
More info here https://t.co/hR4VcAd3aC
Bullish flag suggests a 30% surge for BNB price
Binance Coin price action since Christmas day, December 25, has culminated in a flag pattern, which is a continuation formation. The technical formation comes after a minor consolidation between impulsive legs of a trend, with high chances of the price action breaking out in the direction of the prevailing trend, which is to the north.
A flag pattern forms when there is a strong trending move, normally shown by large body candles, which is then followed by a weak pullback, normally shown by small-bodied candles.The target objective of a flag pattern is determined by measuring the flagpole of the pattern and then superimposing it at the expected breakout point.
With the flagpole of the continuation formation recording a 29.03% climb beginning December 25 to December 28, BNB price could pump in parity, ascending with the same magnitude to attain a market value of $414.70. This setup is contingent on Binance Coin price breaking above the upper boundary of the flag, which calls for increased buying pressure.
Several technical indicators support this thesis, starting with the Bollinger Bands indicator as BNB price continues to trade above the centerline (yellow band) of the indicator, which provides robust support at $279.7. This support level is reinforced by the Parabolic Stop and Reverse (SAR), providing an additional support layer at $301.10.
Also, both the Awesome Oscillator (AO) and the Moving Average Convergence Divergence (MACD) indicators are in the positive territory, adding credence to the bullish outlook. The MACD remains above the signal line (orange band) showing the upside potential remains alive.
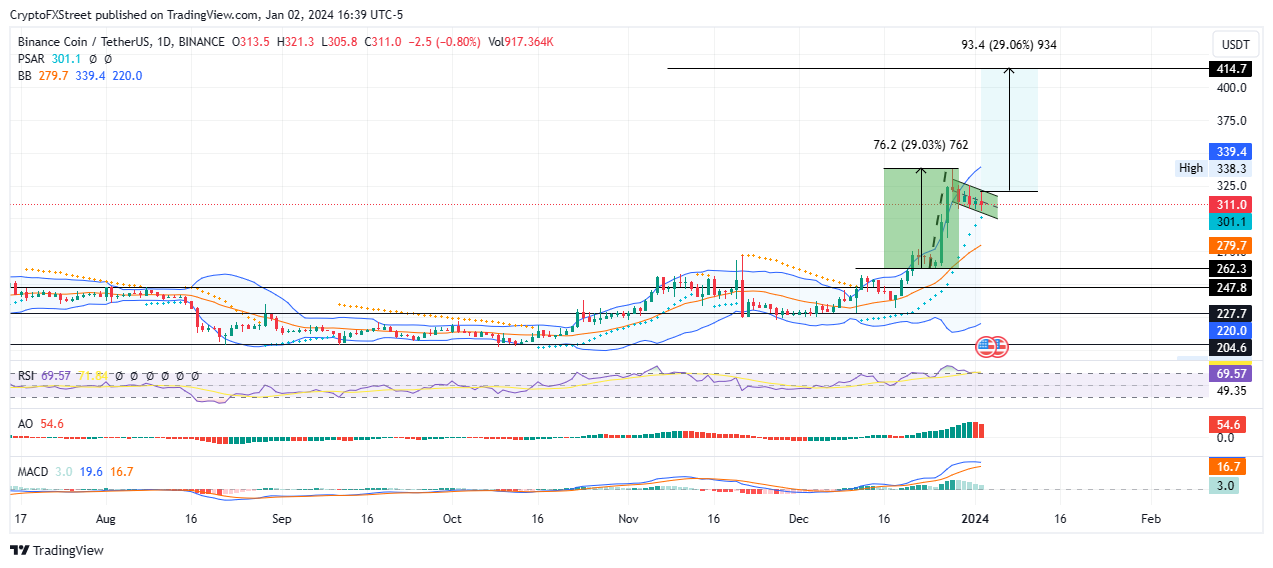
BNB/USDT 1-day chart
On the other hand, bearing in mind that the RSI has just crossed below the signal line (yellow band), a cross-over often interpreted as a sell signal, coupled by the red histogram bars of the AO, BNB price could be due for a correction.
The fading histogram bars of the MACD also point to fading buying pressure, adding credence to the bearish thesis.
If the bears have their say BNB price could descend, breaking below the lower boundary of the flag to test the Parabolic SAR at $301.10. A decisive daily candlestick close below this level would invalidated the prevailing bullish outlook.
In the dire case, the slump could extend for Binance Coin below the centerline at $279.90, or worse, testing the foot of the flag post at $262.30, levels last seen on Christmas day.
Author

Lockridge Okoth
FXStreet
Lockridge is a believer in the transformative power of crypto and the blockchain industry.


