BNB price bullish outlook shakes as Binance battles FUD following Bitcoin withdrawal pause
- BNB price declined nearly 4% over the weekend, as Binance FUD triggered capital outflows.
- Binance informed users that the exchange is moving assets between hot and cold wallets to meet withdrawal requirements.
- The exchange has resumed BTC withdrawals after a temporary halt earlier on Monday.

Binance, one of the largest cryptocurrency exchanges, temporarily halted BTC withdrawals twice in the past 24 hours. This has fueled Fear, Uncertainty and Doubt (FUD) among crypto market participants, and influencers are commenting that the exchange could be “going bust” soon.
Binance CEO Changpeng Zhao (CZ) addressed the FUD surrounding the massive exchange outflows and explained that funds are being moved between hot and cold wallets.
Also read: What the recent meme coin pump means for Bitcoin and Ethereum
Binance records massive exchange outflows
Crypto intelligence tracker Whale Wire reported the largest withdrawal in the exchange’s history, with over 162,000 Bitcoin leaving Binance’s wallets. This outflow is valued at upwards of $4.6 billion.
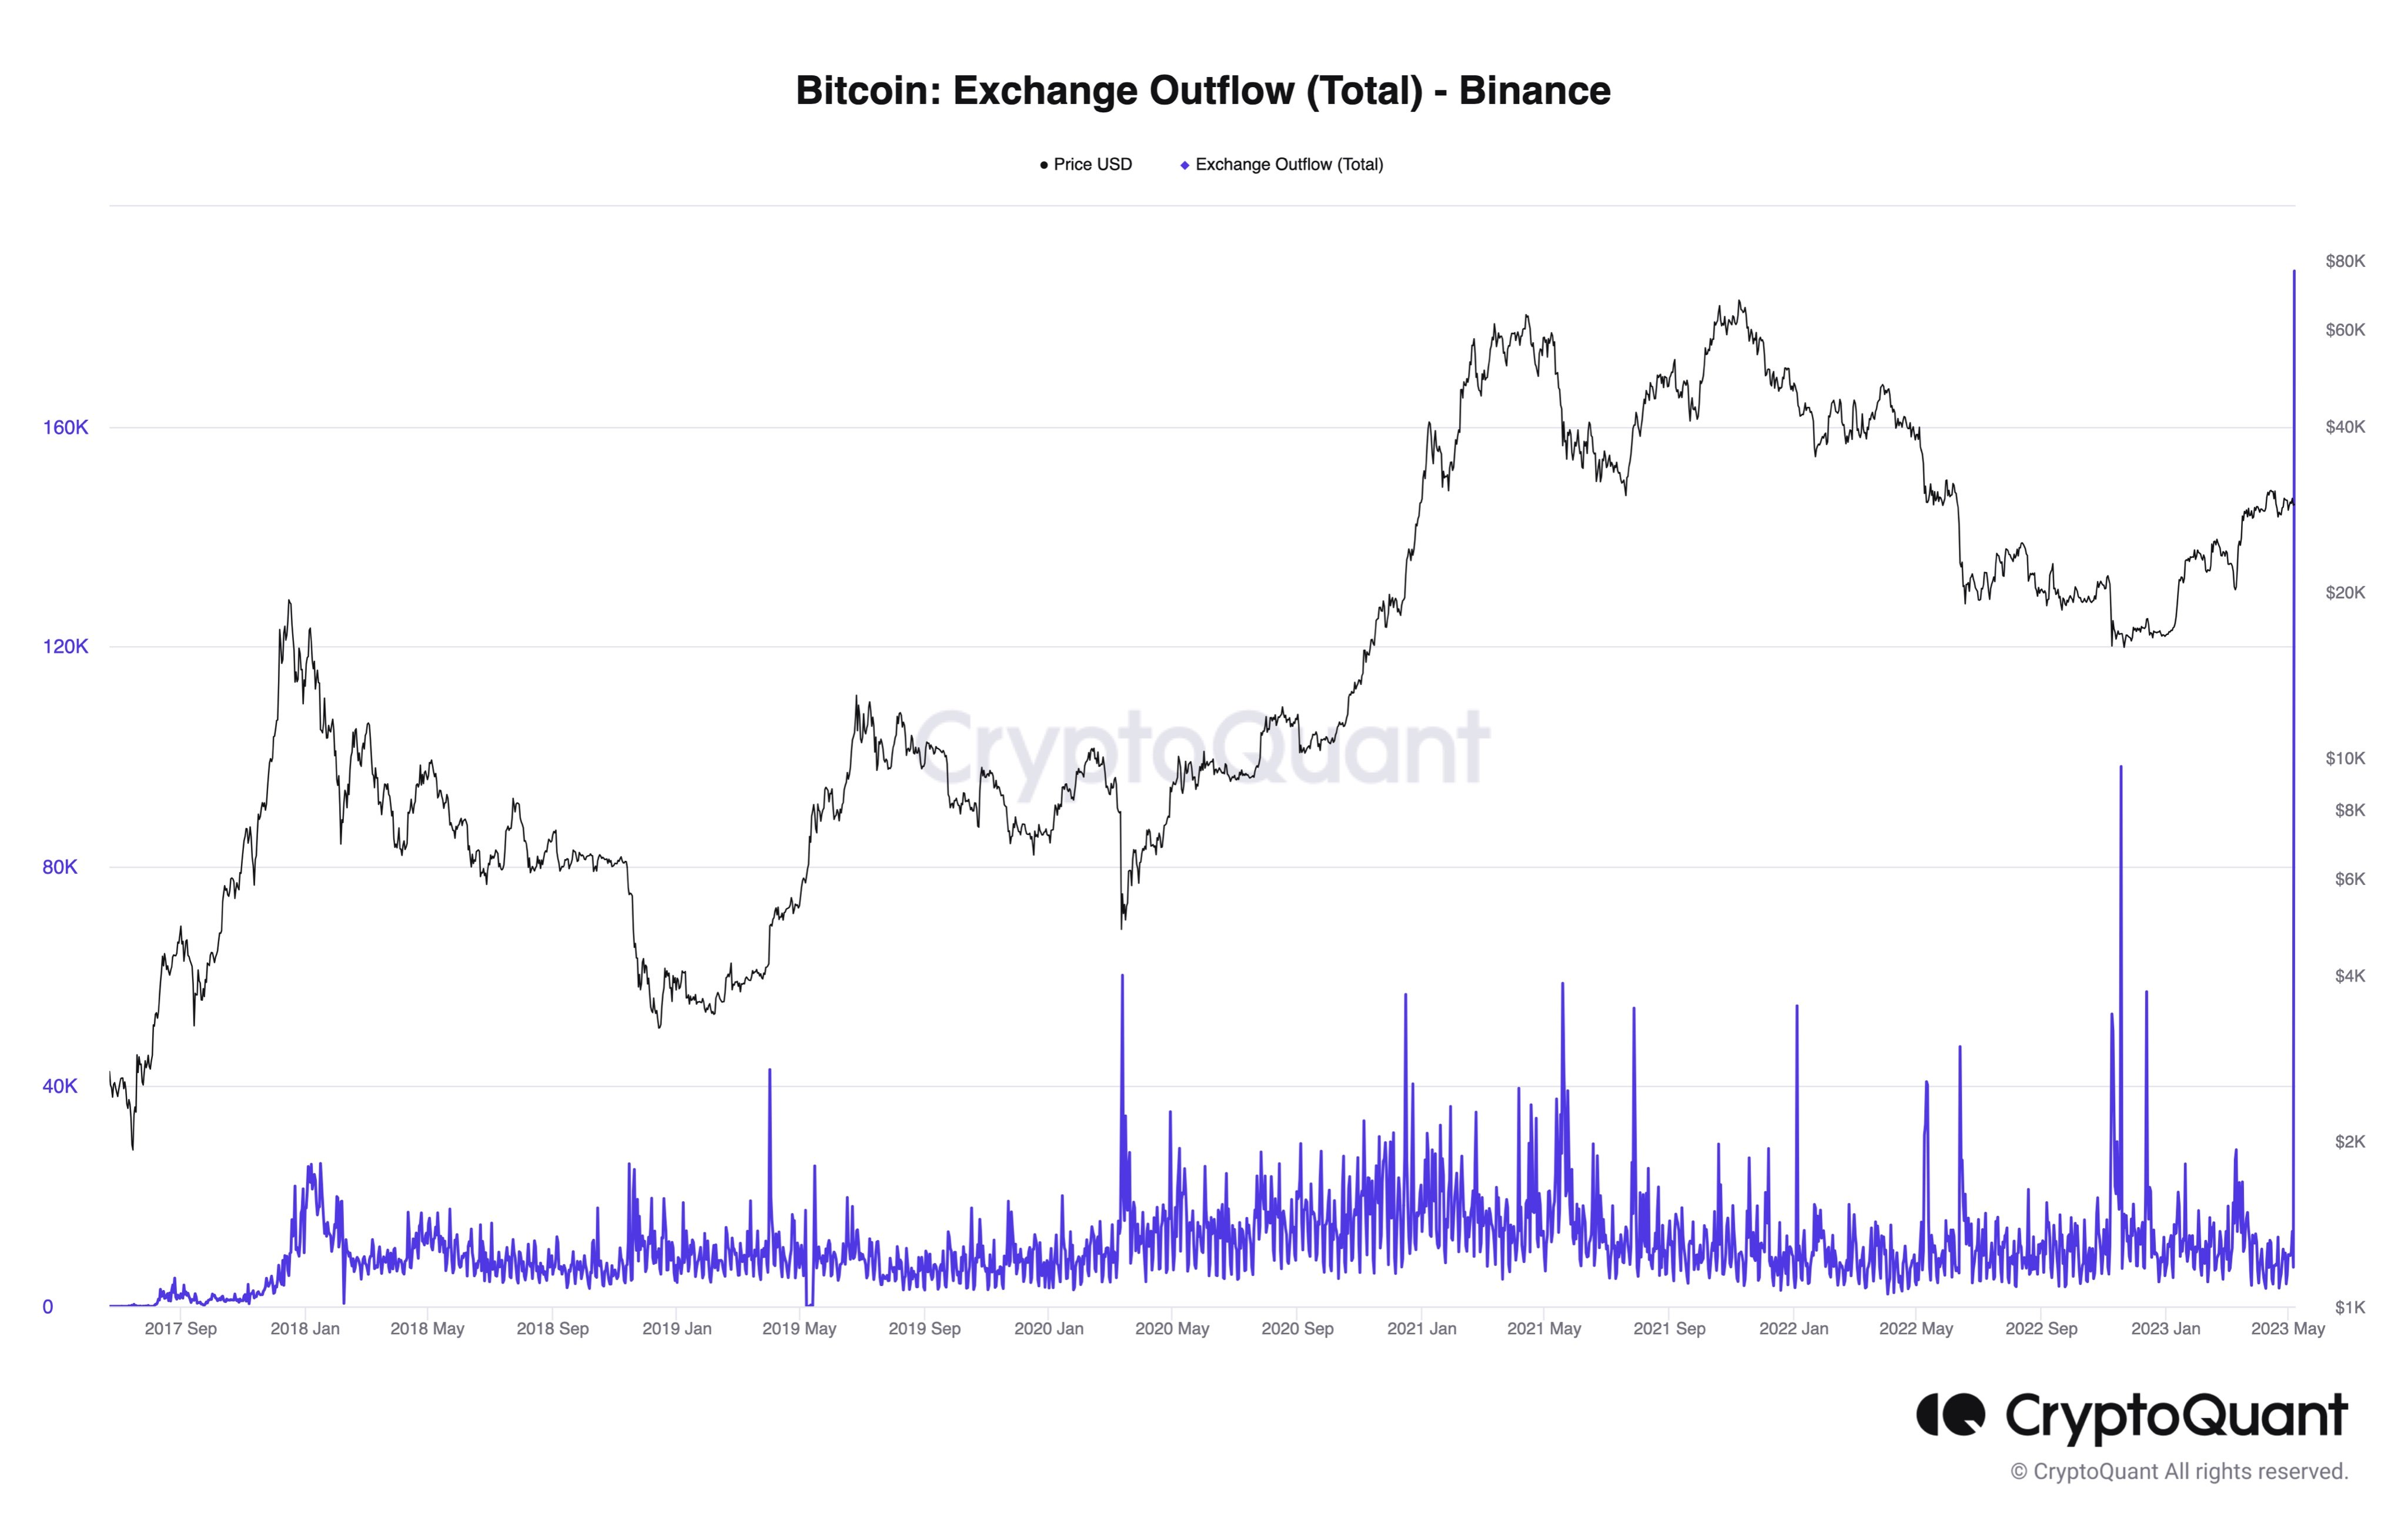
Bitcoin Exchange Outflow on Binance
Binance addressed the withdrawals and explained that the exchange is moving funds between its hot and cold wallets to facilitate the backed-up BTC withdrawals and there is no need for traders to be alarmed by mass withdrawals.
We’re aware that some data are showing a large volume of outflows from #Binance.
— Binance (@binance) May 8, 2023
This ‘outflow’ are actually movements between Binance hot and cold wallets due to the BTC address adjustments.
The largest exchange by volume announced a temporary halt of BTC withdrawals two times in the past 24 hours. Binance cited a large volume of pending transactions as the reason for the halt and shared updates with traders in its recent tweet:
We've temporarily closed #BTC withdrawals due to the large volume of pending transactions.
— Binance (@binance) May 8, 2023
Our team is currently working on a fix and will reopen $BTC withdrawals as soon as possible.
Rest assured, funds are SAFU.
At the time of writing, BTC withdrawals on Binance are available.
BNB price technicals show a long-term bullish scenario
BNB, the native token of Binance, is in an uptrend that started in June 2022. Since then, the token has formed higher highs and higher lows, climbing to a peak of $397.9 in November 2022.
There is a support zone formed between $264.7 and $304.5. BNB spent a large chunk of time in this zone. Therefore, once BNB price breaks out of the zone, it indicates a continuation of its upward trend.
BNB price is currently above two of its long-term Exponential Moving Averages (EMA), the 50-day and 200-day EMAs. The immediate resistance faced by BNB is at $338, a key resistance level for the past year, equal lows at $360, 38.2% Fibonacci level at $379.9, the November peak at $397.9, and equal highs at $397.9.
If BNB price drops below its two long-term EMAs and enters the support zone, the bullish thesis will be invalidated.
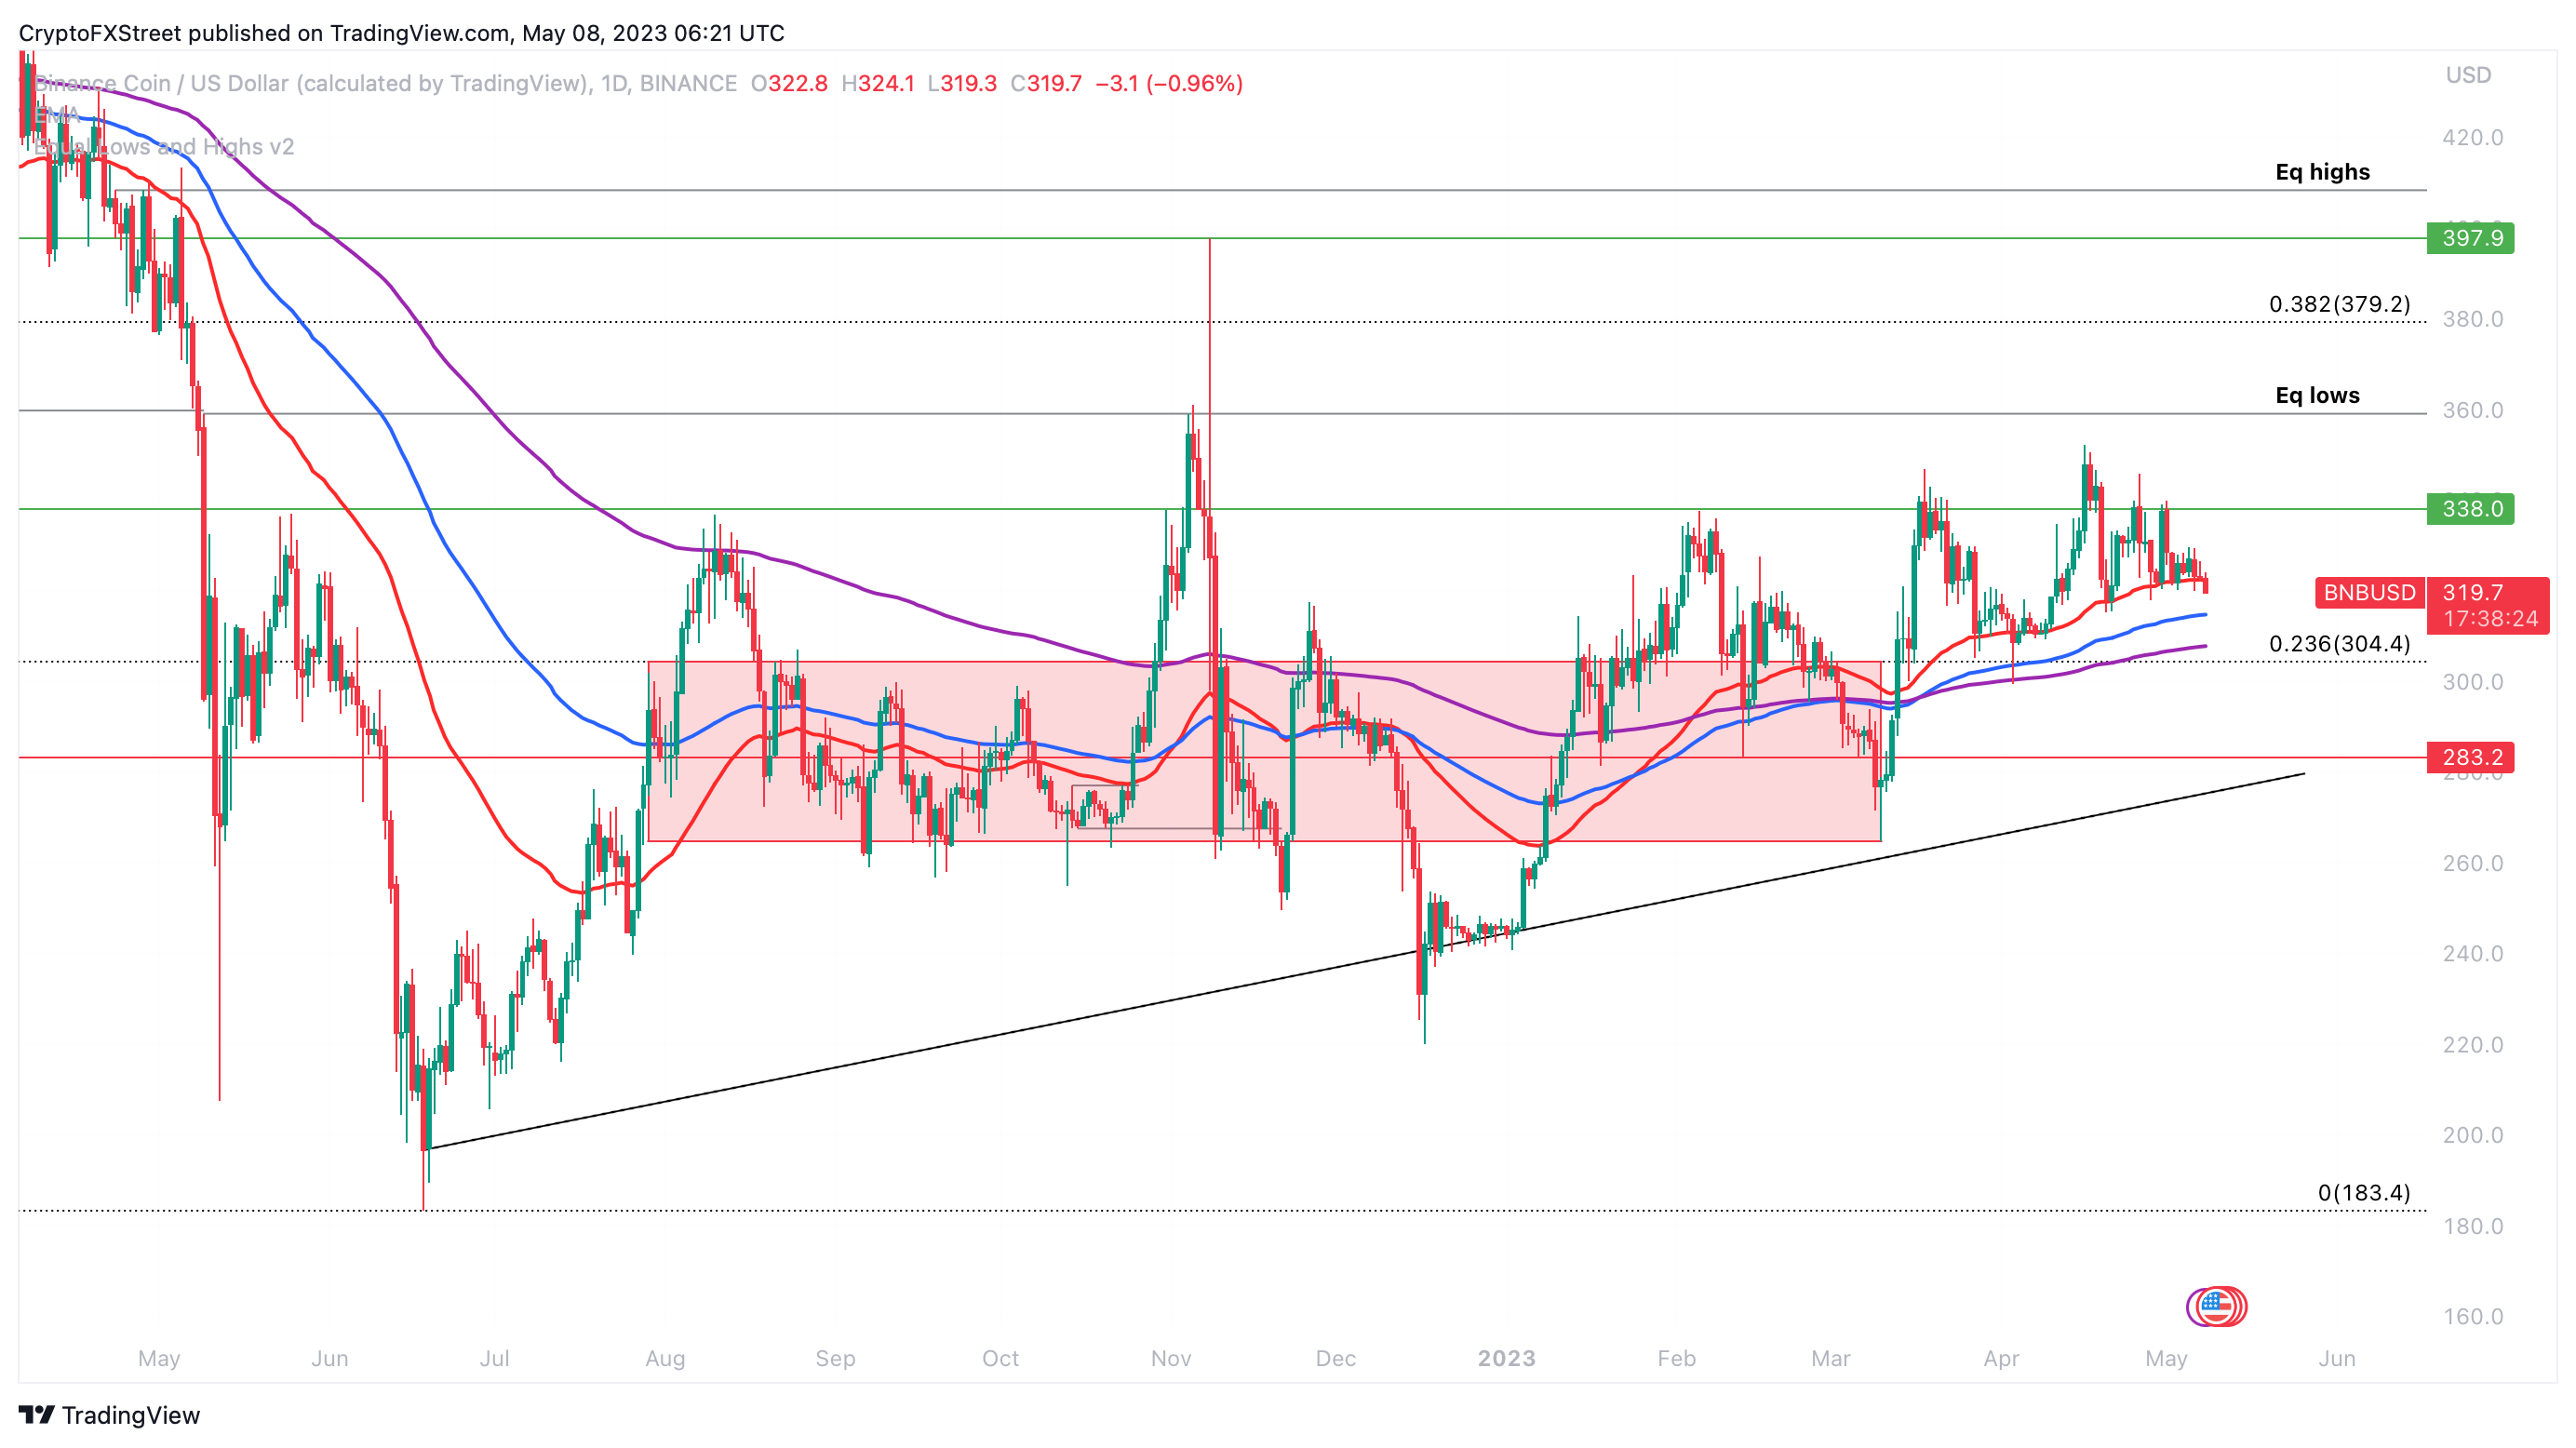
BNB/USD 1D price chart
A definitive close below the ascending trendline could signal a bearish trend reversal in the exchange’s native token.
Author

Ekta Mourya
FXStreet
Ekta Mourya has extensive experience in fundamental and on-chain analysis, particularly focused on impact of macroeconomics and central bank policies on cryptocurrencies.



