Bitcoin Weekly Forecast: The last rebound before capitulation
- Bitcoin price looks ready for a quick run-up to $36,000 as the recovery rally kick-starts.
- Investors need to exercise caution as this run-up could be a long-squeeze in disguise.
- A weekly candlestick close above $52,000 will invalidate the bearish thesis for BTC.

Bitcoin price is showing bullish signs in the lower time frames, which can be taken advantage of by traders in the next couple of days. But looking at BTC from the highier time frames suggests that the bottom is not in yet.
Bitcoin price and the week to come
Bitcoin price is sticking close to a range that extends from $29,720 to $32,671. These barriers were set up on May 10, before BTC crashed to $25,333. Since then, BTC has been struggling to move higher and is grappling with the range low.
BTC has swept Monday’s low at $29,040 and is aiming to move back to Monday’s high at $31,309, which coincides with the 50% retracement level of the May 10 range. Investors waiting on the sidelines can scalp this rangebound movement with ease by opening a long position around the range low.
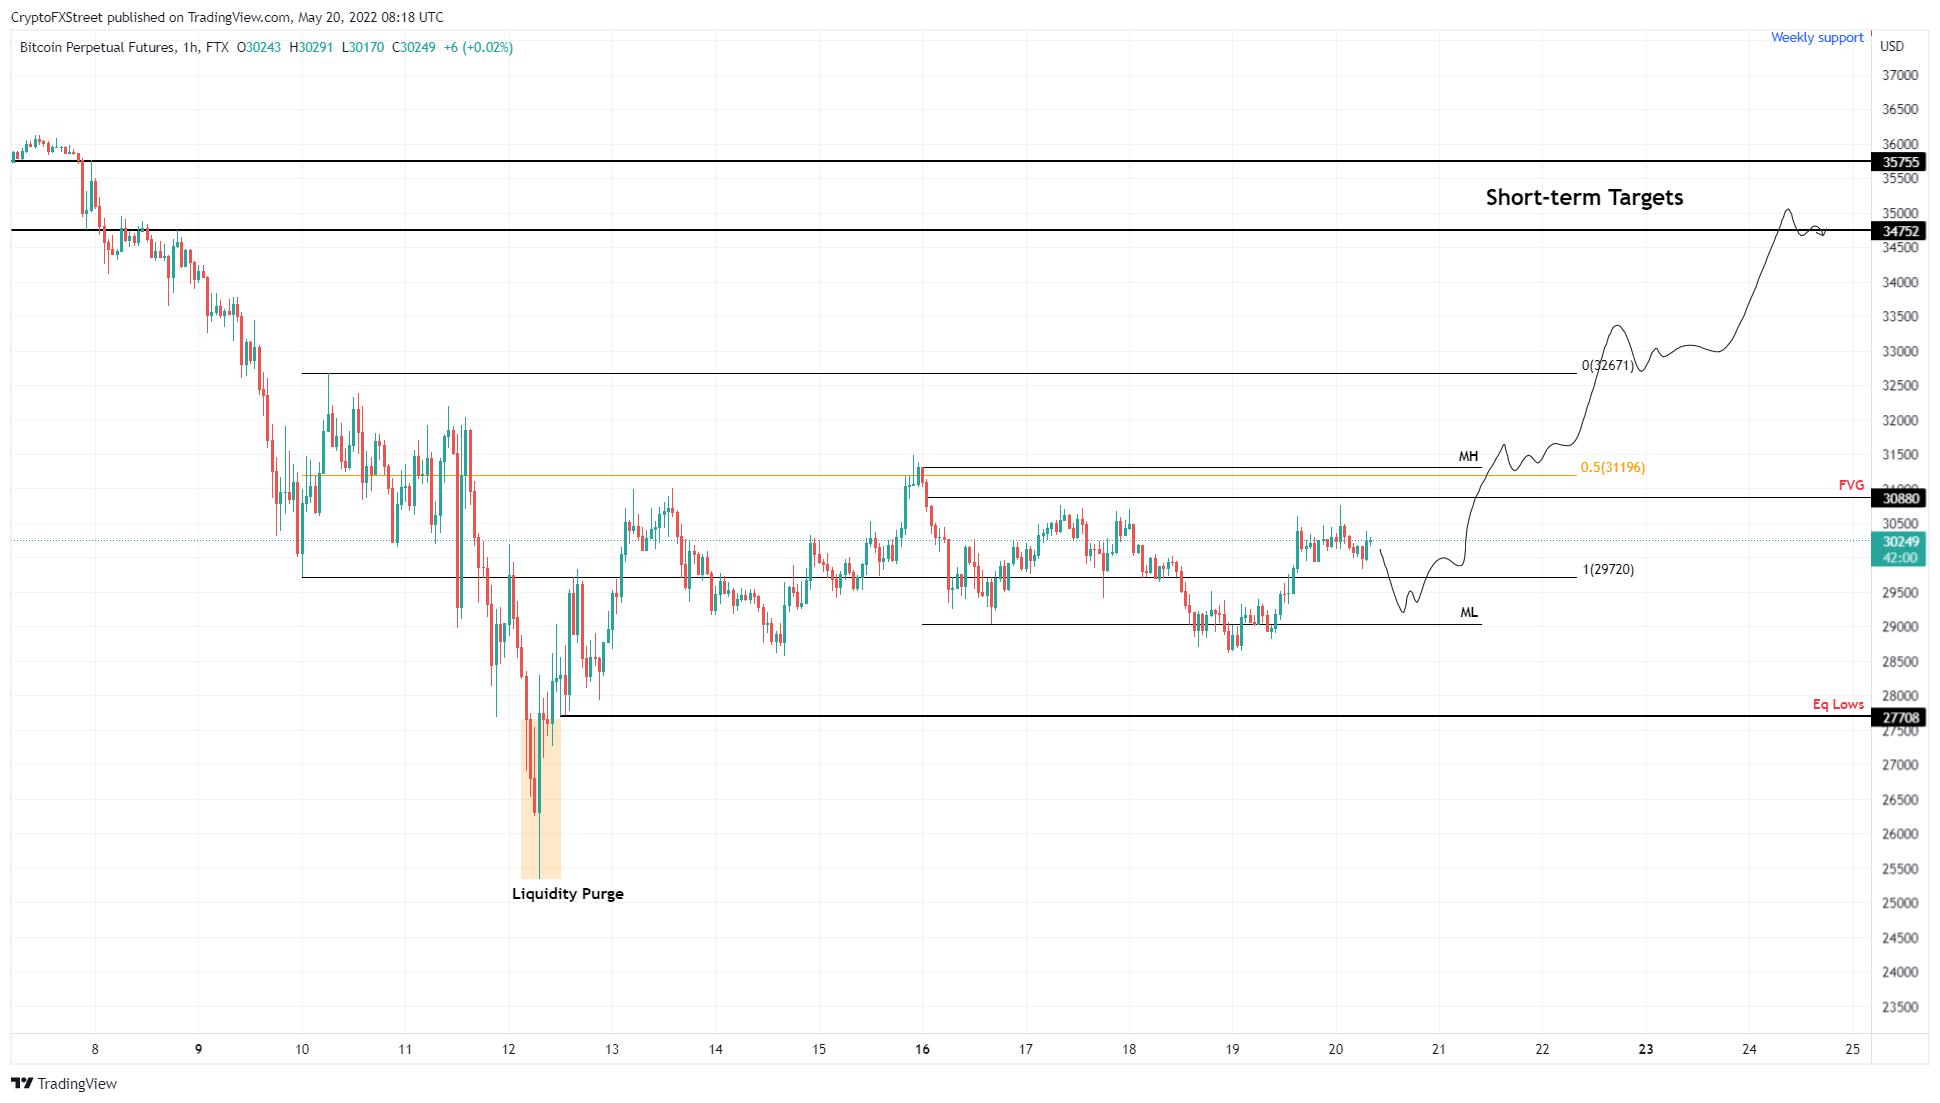
BTC/USDT 1-hour chart
The first target is Monday’s high at $31,309; clearing this barrier will open the path for the next hurdle at $32,671. Considering the state of the markets and the explosively bouncing altcoins, the capital is likely to rotate into BTC pushing it back to the $35,000 to $36,000 area. This range breakdown is what triggered the initial crash from a long-term perspective.
A move up to the $36,000 barrier could get many traders excited and cloud their judgment with a bull rally, which would be the perfect setup for a long squeeze or a dead cat bounce. Regardless of what happens around $36,000, market participants can ride this ascent over the next week for good profits.
BTC whales align with the bullish idea
The whales holding between 1,000 to 10,000 BTC have been the most correlated to Bitcoin price than any other category of holders. Hence, watching these investors closely would give a sense of their investment thesis.
The number of wallets holding 1,000 to 10,000 BTC has increased from 2,127 to 2,133 over the past week. Although the uptick might not seem a lot on a percent basis, six new wallets have joined this category, hingint at the accumulation. Ultimately, this trend reveals that these market participants are also looking to capitzlie on the minor uptrend that is yet to occur.
 [13.46.43, 20 May, 2022]-637886353762733269.png)
BTC supply distribution
A sidenote is that the wallets holding 10,000 to 100,000 BTC have also risen 88 to 89 whales over the past week. But the kicker is that these whales have been accumulating since February 22.
How to trade the dead cat bounce
From a one-day time frame, this run-up detailed above makes sense due to the bullish divergence formation. This technical setup contains the asset forming and lower low while the momentum indicator, in this case, the Relative Strength Index (RSI), creates a higher low.
The said pattern resolves into a bullish outlook for the underlying asset, aka Bitcoin price.
While the short-term scenario is appealing, investors should not lose sight of the bigger picture as the long squeeze will be complete only after a massive crash. A daily candlestick close below $27,668 will trigger a further descent to $18,179, which is the target forecasted by the bear flag setup.
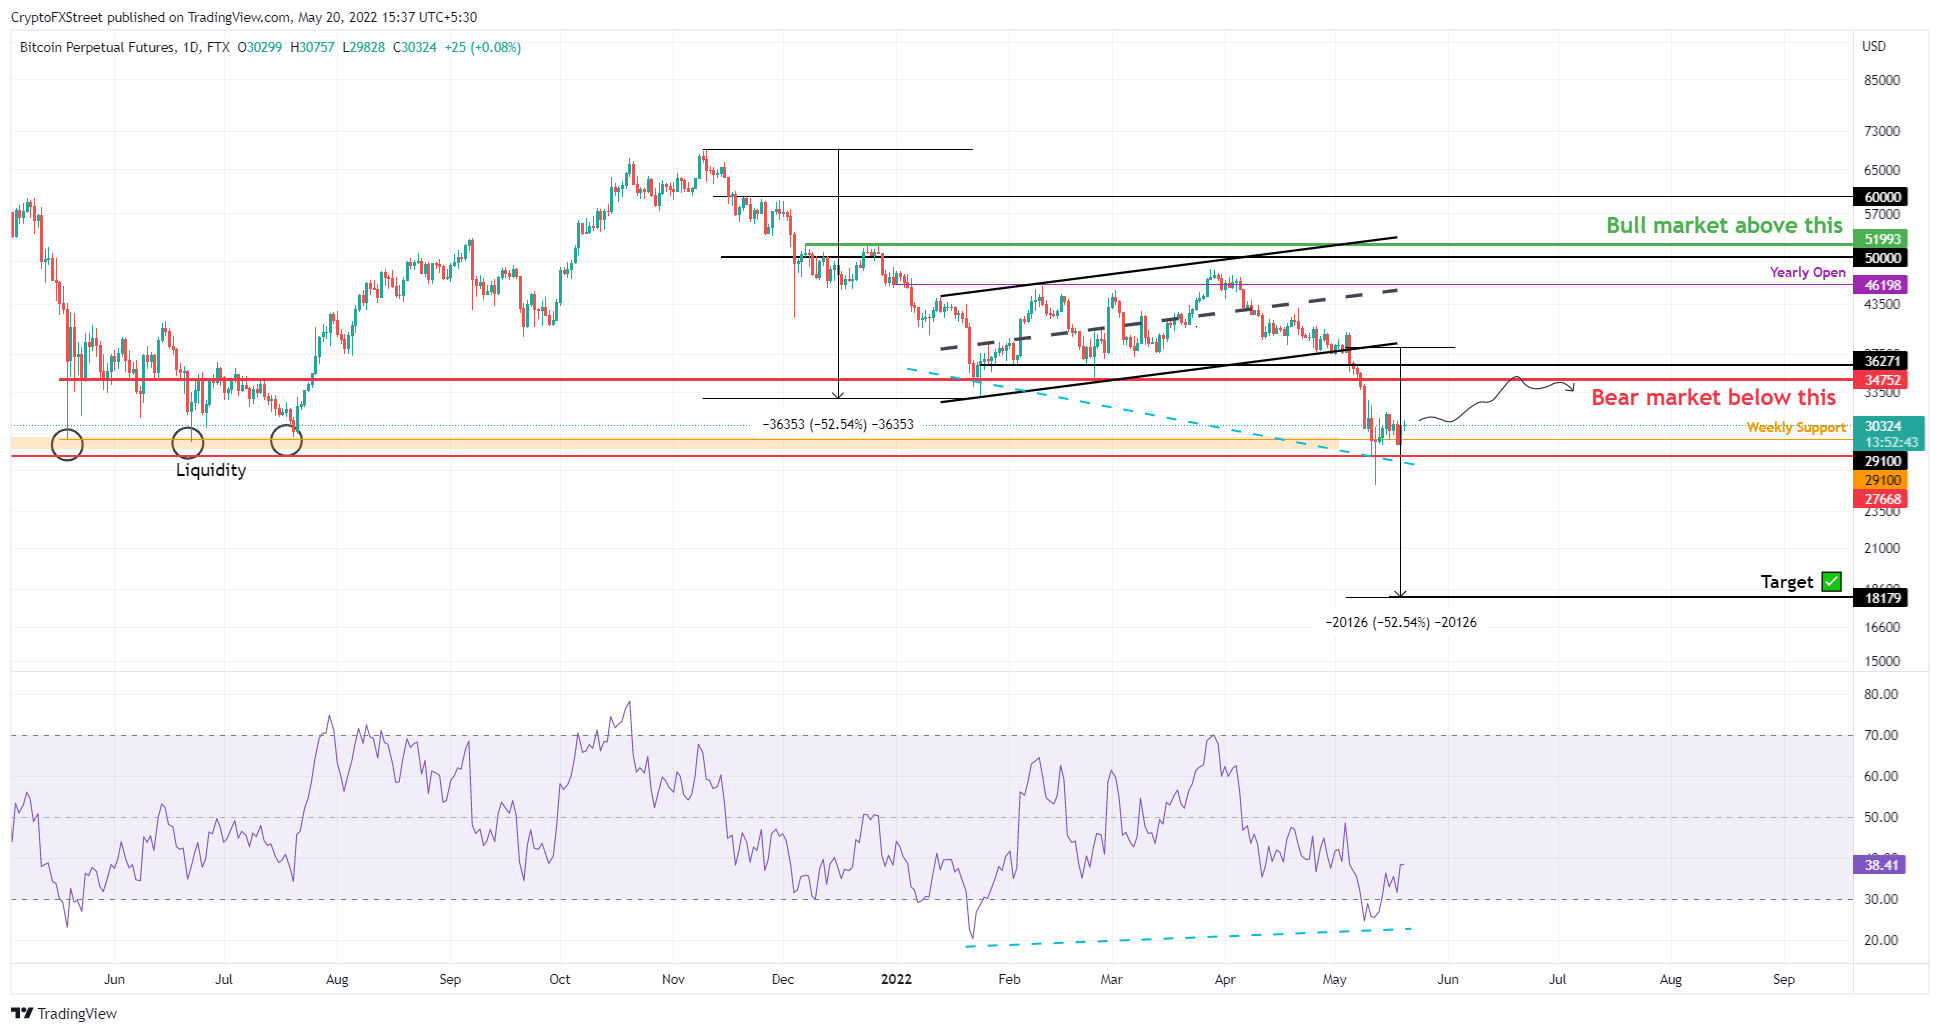
BTC/USDT 1-day chart
Interestingly, $18,179 is a high confluence level because multiple time frames indicate that a macro bottom could form around this level. A move from $36,000 to $18,000 would constitute a 50% crash, which is not unheard of in the crypto space, at least for Bitcoin price.
On-chain metrics hint bottom is not in yet
Further supporting the macro bottom for Bitcoin price are the on-chain metrics, which are also suggesting the possibility of a further crash.
The Net Unrealized Profit/Loss (NUPL) is one such metric which is the difference between holders with relative unrealized profit and relative unrealized loss. The numerical value obtained is essentially a representation of the market sentiment. Shifts in this number indicates the change in investors’ emotions and can help predict market tops and bottoms.
The NUPL tends to signal a market top when it detects that investors’ sentiment enters the “Greed” stage. This is usually a good time to book profits, which tends to accelerate a price correction. As prices decline, so does the market sentiment, which moves from Greed to Denail, from Denial to Anxiety, from Anxiety to Fear, and from Fear to Capitulation to mark the market bottom.
Following the $69,000 all-time high, the NUPL moved from Greed to Denial. The price correction below $40,000 in May 2021 and below $47,000 in December 2021, saw the market sentiment shift from Denial to Anxiety. And most recently, the drop below $30,000 changed the market sentiment from Anxiety to Fear.
If this on-chain metric remains as accurate as it has been in the past ten years to anticipate market bottoms, then another steep correction, perhaps towards $18,179, has yet to happen for the sentiment to go from Fear into Capitulation to put an end to the downtrend.
-637886381105661879.png)
BTC NUPL
Unlike most of the times, Bitcoin price is in a really good position for both long-term and short-term investors. For those with higher risk appetite, a minor uptrend to $36,000 is plausible, but these investors need to be careful of a long-squeeze.
Regardless of the short-term outlooks, if Bitcoin price produces a weekly candlestick close above $52,000, the bullish thesis will face invalidation. In such case, BTC price could ascend higher and tag the current all-time high at $69,000.
Author

Akash Girimath
FXStreet
Akash Girimath is a Mechanical Engineer interested in the chaos of the financial markets. Trying to make sense of this convoluted yet fascinating space, he switched his engineering job to become a crypto reporter and analyst.



