Bitcoin Weekly Forecast: If bulls lose control here, BTC could revisit $21,000
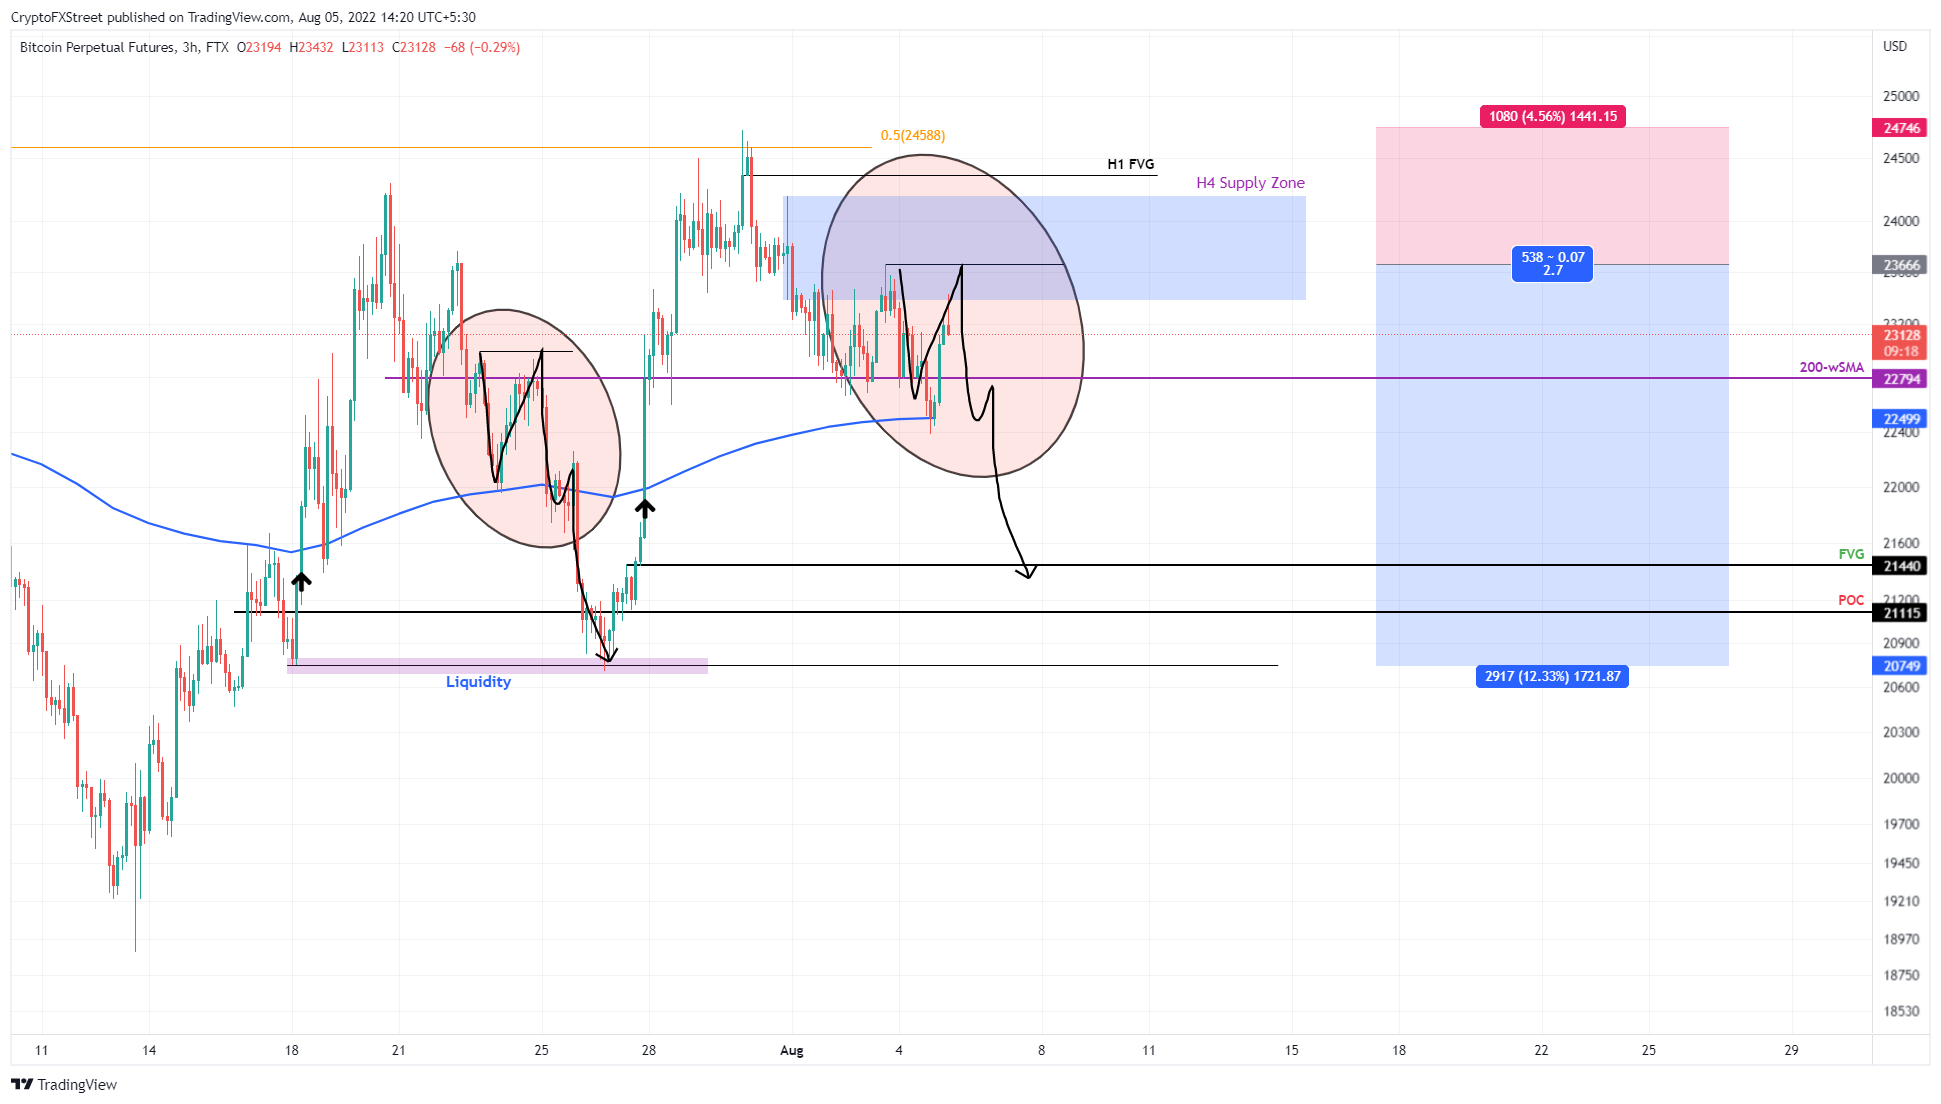
- Bitcoin price shows a fractal formation on a lower timeframe chart, suggesting a potential reversal in the trend.
- This development hints at a revisit of the four-hour price inefficiency at $21,440, which could extend to $21,115.
- A successful flip of the $24,565 resistance level into a support floor will invalidate the bearish thesis.

Bitcoin price shows an interesting setup that could reveal its next move. On closer inspection, its technicals support a bearish outlook for the leading crypto.
Crypto’s major fundamental developments
Not everything is negative for Bitcoin price, however, when investors take into account the fundamental developments that have occurred over the last week. Perhaps, the most important is the entry of BlackRock, the largest asset manager in the world, into the cryptocurrency space via a partnership with a US-based digital asset exchange, Coinbase.
The news of this update caused the Coinbase stock to soar by more than 10%.
Another noteworthy update is the announcement from the Chicago Mercantile Exchange’s (CME) launch of Bitcoin and Ether Euro futures on Aug. 29.
Despite these fundamental developments, Bitcoin price stayed relatively stable for a few hours but eventually dropped below the 200-week Simple Moving Average (SMA) at $22,794 and retested the 30-day Exponential Moving Average (EMA) at $22,499.
Now things look relatively grim, however, as this newly developed BTC fractal forecasts a bearish outlook.
Bitcoin price ready for more pain
Bitcoin price fractal revolves around the 30-day EMA, and the last time BTC pushed above this fractal, it rallied roughly 13% and set a local top at $24,296. This move was undone in the next five days as the big crypto tried to use the recently flipped 30-day EMA as a support floor.
However, what’s interesting is the Bitcoin price action that resulted in a downtrend: it formed a double top pattern as BTC tried using the 30-day EMA as a crutch to prevent its downtrend.
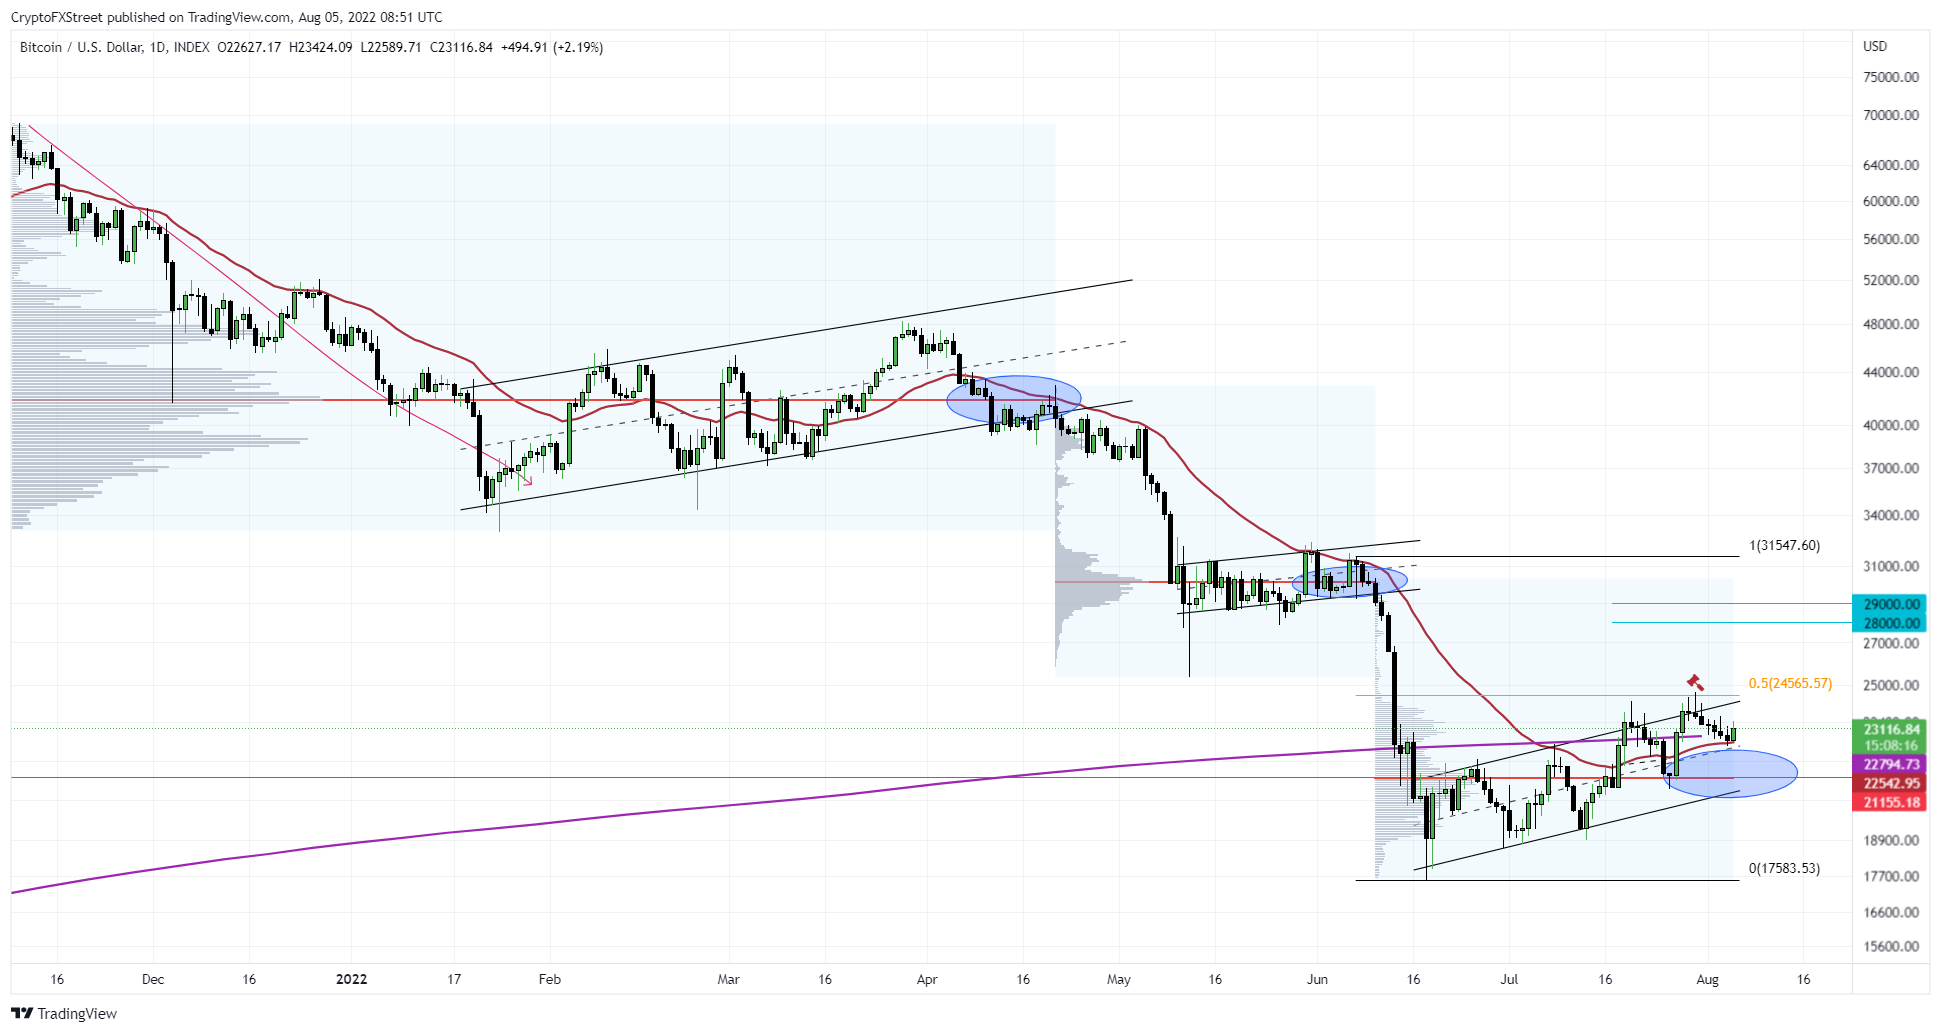
After a few days of trending below the aforementioned EMA, the Bitcoin price has once again shattered through the 30-day EMA and rallied 8%, only to get rejected at the 50% retracement level at $24,565. This barrier is the midpoint of the 42% crash between April and June 2022.
Adding credence to this bearish outlook is the four-hour supply zone, extending from $23,383 to $24,194. So far, the Bitcoin price has already pierced this level, triggering a potential short setup. However, investors can choose to be patient and wait for a retest of the $23,666 swing high for a double top formation.
BTC/USDT 4-hour chart
Going forward, if BTC formed another double top at $23,666, it would recreate the fractal and forecast an incoming crash.
The targets for this setup include the 200-week SMA at $22,749, followed by the price inefficiency, aka the fair value gap at $21,440 and the volume at $21,115.
This barrier is the highest traded level for BTC volume since April 2022. More details can be found in the chart attached below. At POC, market participants can expect a massive surge in buying pressure and a struggle between the buyers and sellers.
This fight is a common theme across all the ascending parallel channel fractals seen since the start of 2022. Hence, if investors are looking to short the double-top formation at $23,66, they should consider booking profits at $21,115.
BTC/USD 1 -day chart
Invalidation Scenarios for BTC
If investors are on board with the idea of shorting the Bitcoin price, they should also consider scenarios in which this thesis explained above will be invalidated.
The first invalidation scenario is for investors with tight stop-losses, ie., above the four-hour supply zone’s upper limit at $23,666. In such cases, if Bitcoin price decides to retest the one-hour FVG at $24,362, the aforementioned stop losses will be hit.
While this might seem bearish, market participants can either set a wider stop-loss or reenter short at $23,666.
The second invalidation scenario is much grimmer for bears than it is for bulls as it involves a flip of the $24,565 resistance level into a support floor. This development will indicate the resurgence of bullish momentum and invalidate the fractal formation.
In such a case, market participants need to heed the market signals and position themselves accordingly, aka long. This development could see BTC retest the $28,000 to $29,000 levels to form a local top.
Author

Akash Girimath
FXStreet
Akash Girimath is a Mechanical Engineer interested in the chaos of the financial markets. Trying to make sense of this convoluted yet fascinating space, he switched his engineering job to become a crypto reporter and analyst.



