Bitcoin Weekly Forecast: BTC recovery foiled as Elon Musk resurfaces, adoption continues
- Bitcoin price dropped 6% and continues to decline after Elon Musk’s recent tweet.
- Google decides to run crypto-related ads after early 2018 ban.
- China pulls a 180 as state-run media outlets reveal that the public is free to trade cryptocurrencies.

Bitcoin price is currently witnessing massive selling pressure, likely from retail buyers, after Tesla CEO Elon Musk issued another market-convulsing tweet. Although vague, retail has already started offloading its holdings. While this is bearish in the short-term scenario, several on-chain metrics suggest the opposite.
Bitcoin price tanks
Tesla CEO Elon Musk's involvement in Bitcoin has been an interesting development to track. His tweets on May 12 and May 19 played an important role in accelerating the BTC price crash.
Today, the business magnate posted a cryptic tweet, which reignited a rumor that Tesla might have sold its Bitcoin holdings.
#Bitcoin pic.twitter.com/lNnEfMdtJf
— Elon Musk (@elonmusk) June 4, 2021
If true, this could play out in favor of the bears pushing Bitcoin price down. especially when considering China's crackdown on the BTC mining industry.
Regardless, this week the state-owned Xinhua News Agency and China Central Television mentioned that the “general public has the freedom to participate in the trade at their own risks.” China’s stance on the cryptocurrency markets seems to remain indecisive while Google has overturned its March 2018 ban, which prevented people from running crypto-related ads.
Google’s statement on Wednesday reads,
Beginning August 3, advertisers offering Cryptocurrency Exchanges and Wallets targeting the United States may advertise those products and services when they meet the following requirements and are certified by Google.
The move from Google is a significant step that will help businesses in the cryptocurrency ecosystem grow, thereby boosting its utility.
Bitcoin adoption, which soared in early May, seems to have slowed down in the first week of June. The U.S. Securities & Exchange Commission (SEC) revealed that it would be delaying its decision on WisdomTree's proposed Bitcoin ETF listing from May 30 to July 14.
Indecision intensifies
Bitcoin price is in a sticky situation and hints at a bearish breakdown. BTC is forming a potential head-and-shoulders pattern, which eyes another brutal 53% sell-off if it breaches the neckline at $29,936. However, this bearish scenario is not set in stone and will face invalidation if BTC continues to rise.
But rejection around $42,000 leading to a breakdown of the horizontal resistance at $29,936 will trigger a bearish outlook for Bitcoin price.
Additionally, the flagship crypto is also forming a bearish pennant pattern. This technical formation contains a massive sell-off, known as the flag pole, and is usually followed by a consolidation referred to as the pennant.
This setup forecasts a 50% downswing and is triggered by a breakdown of the pennant’s lower trend line at $35,965.
Although the recent surge in Bitcoin price seemed to disregard this bearish pattern, Musk’s tweet has sent it into a tailspin. If BTC continues to bleed and manages to produce a daily candlestick close below $35,965, it will indicate a bearish breakout and trigger a downswing.
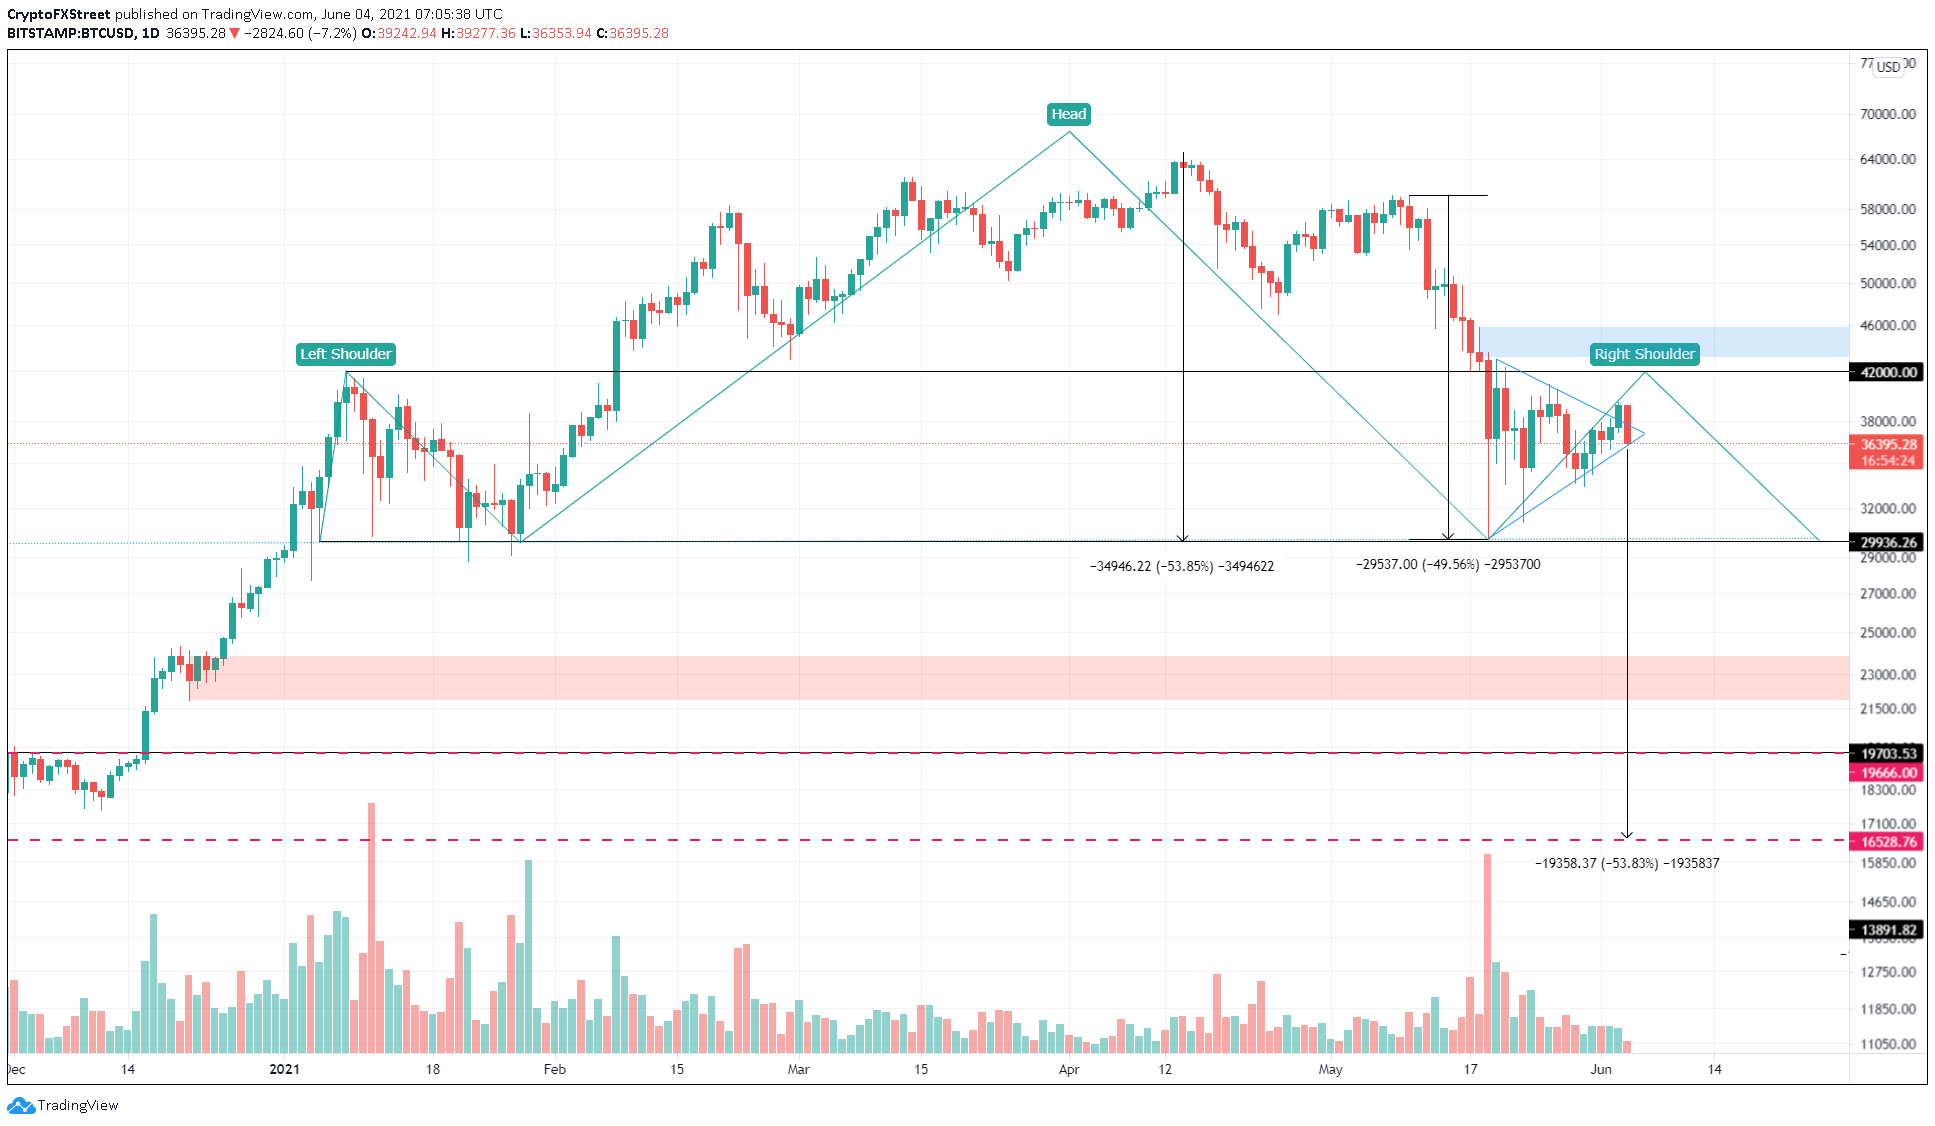
BTC/USD 1-day chart
With these looming bearish patterns, the market is unlikely to be optimistic about the pioneer cryptocurrency. Supporting a drop in Bitcoin price is the 365-day Market Value to Realized Value (MVRV) model, which is around 0%.
This index gauges the health of the BTC network by tracking the average profit/loss of investors who purchased BTC in the past year. Despite almost resetting from 110% on February 11, this metric suggests room for down moves.
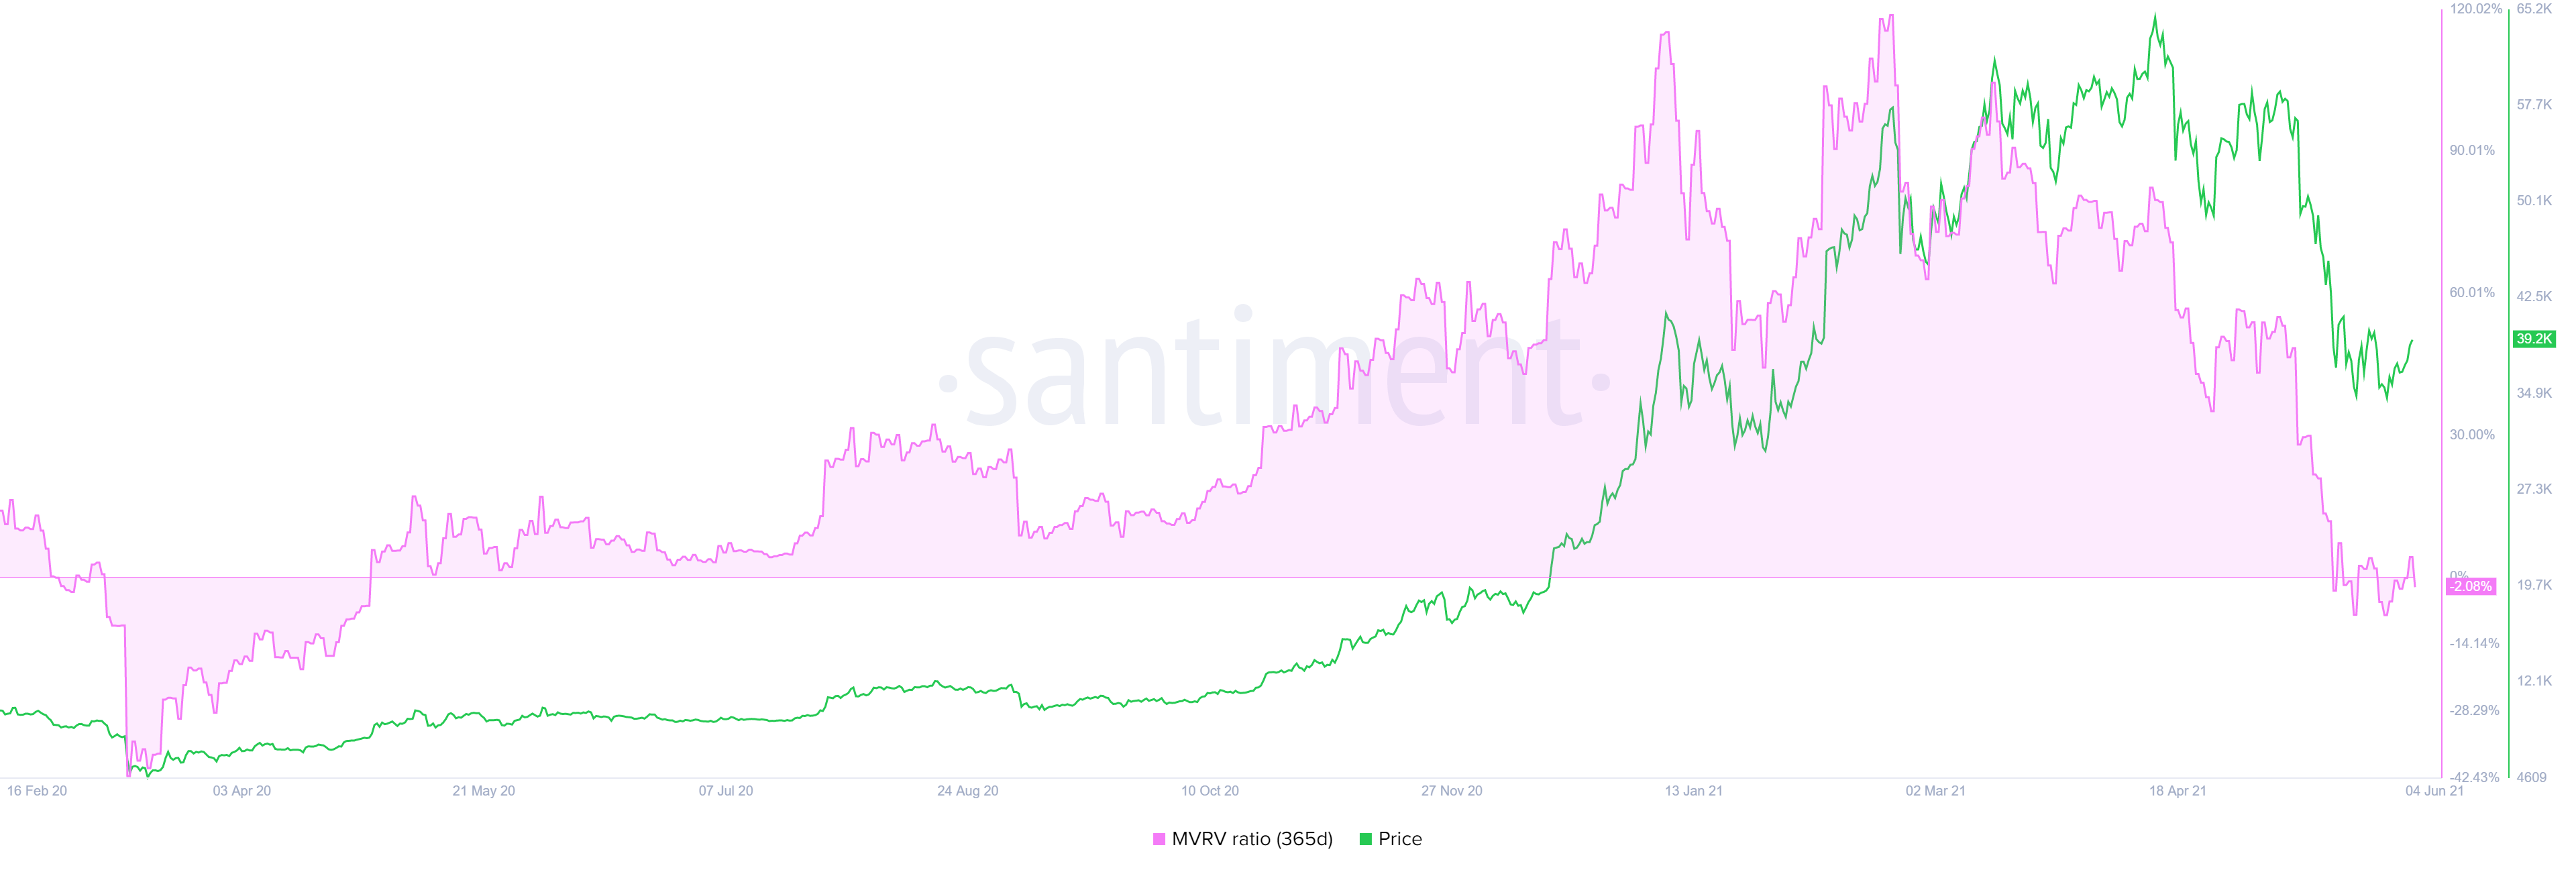
BTC 365-day MVRV chart
The supply on exchanges metric is straightforward, and an increase in this index can be interpreted as a potential increase in the sell-side pressure.
From March 1 to date, the number of BTC held on exchanges dropped from 1.97 million to 1.93 million, suggesting that some of the inventors were optimistic about Bitcoin price performance shortly.
However, since March 1, the BTC on centralized entities has increased roughly 3.2% from 1.87 million to 1.93 million, indicating an increase in the mid-to-long-term trend.
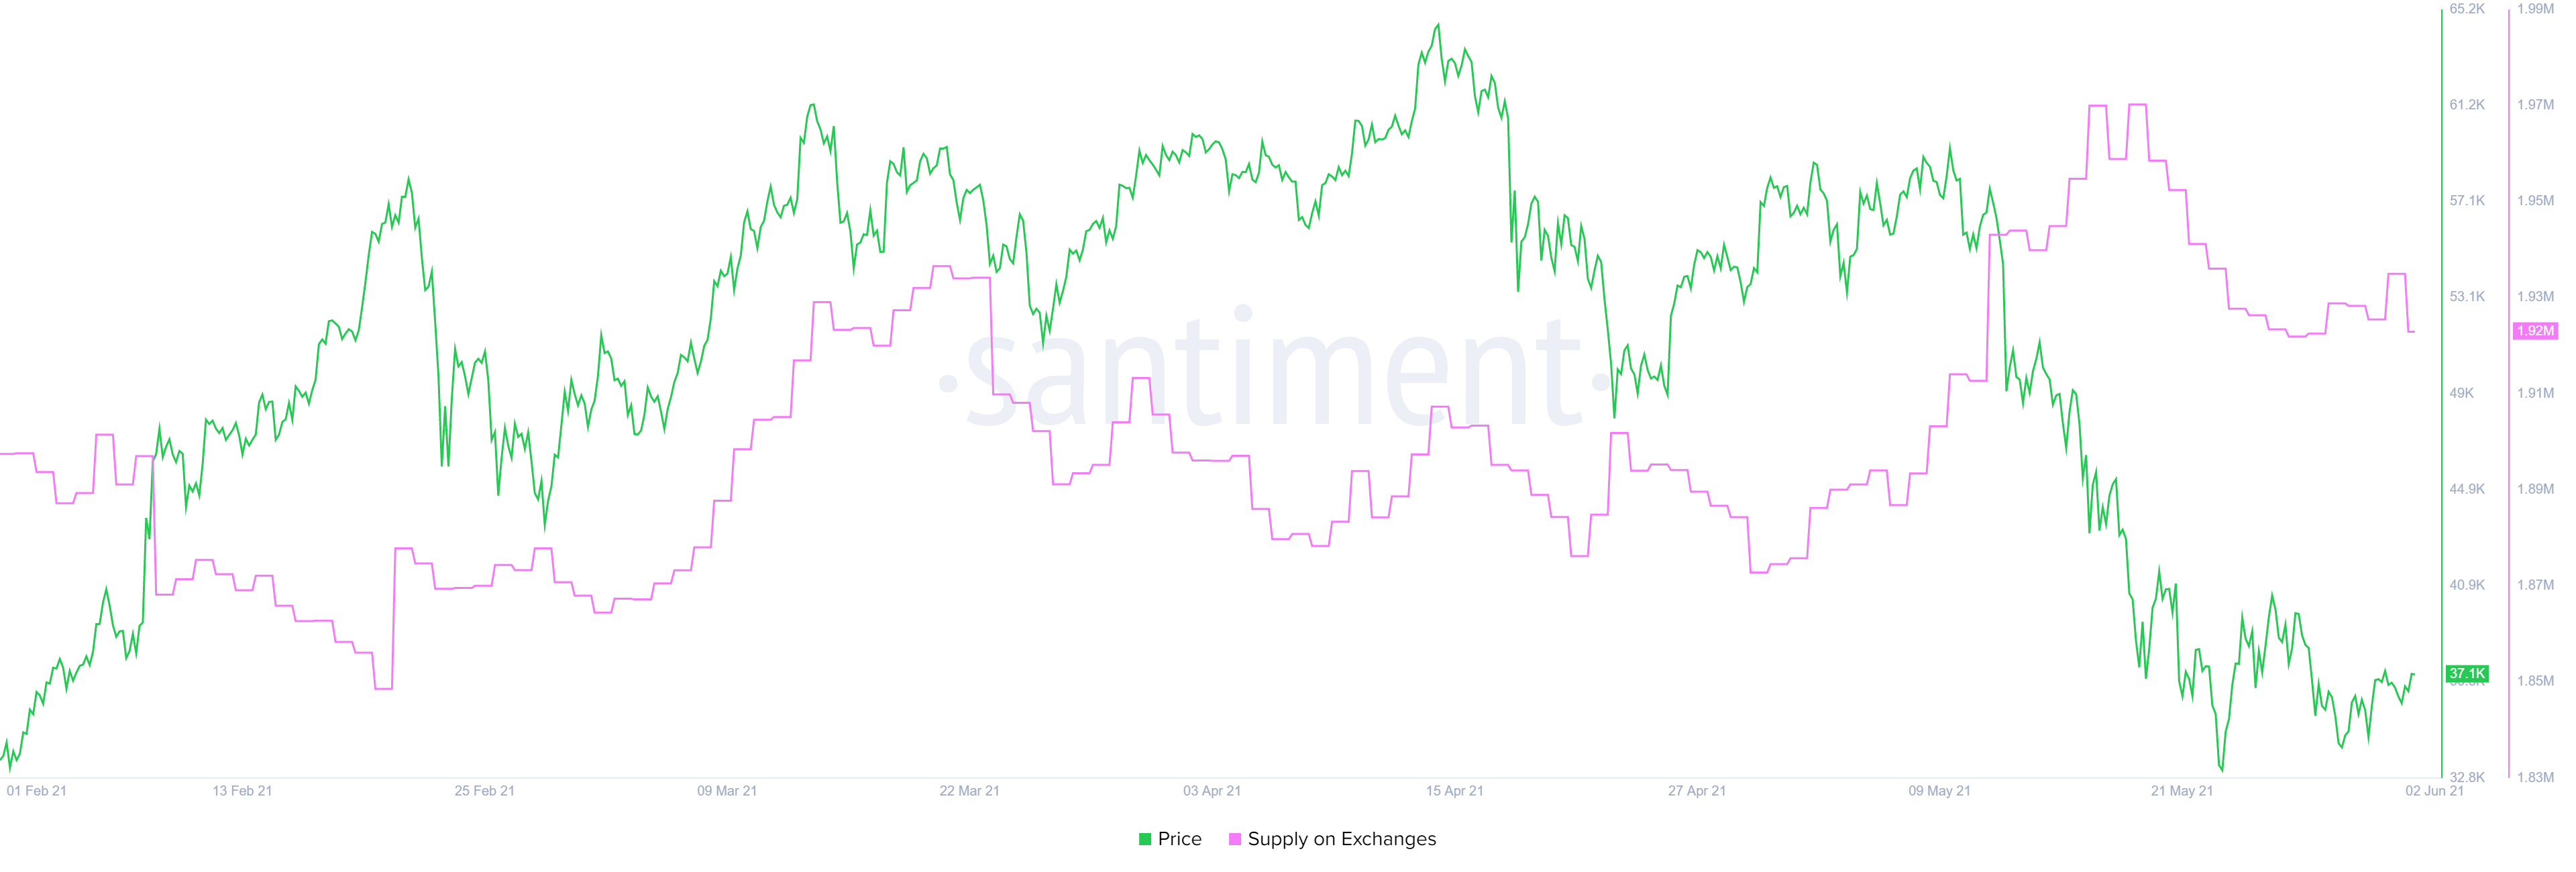
BTC supply on exchanges chart
While the current state of Bitcoin price does not necessarily instill confidence, a decisive daily close above $46,000 will signal the start of an upswing and invalidate the bearish pennant pattern.
However, if BTC breaches past $50,000, it would put an end to the head-and-shoulders formation. This move would also trigger retail FOMO, pushing it toward the swing high on May 10 at $59,600.
Supporting this scenario is the Stablecoin Supply Ratio (SSR). This metric is the ratio of the BTC held on centralized entities and the stable coin supply on exchanges. A reduction in this index suggests higher buying power.
The SSR dropped from 13.84 on May 1 to 7.14 to date, registering a 48% drop.
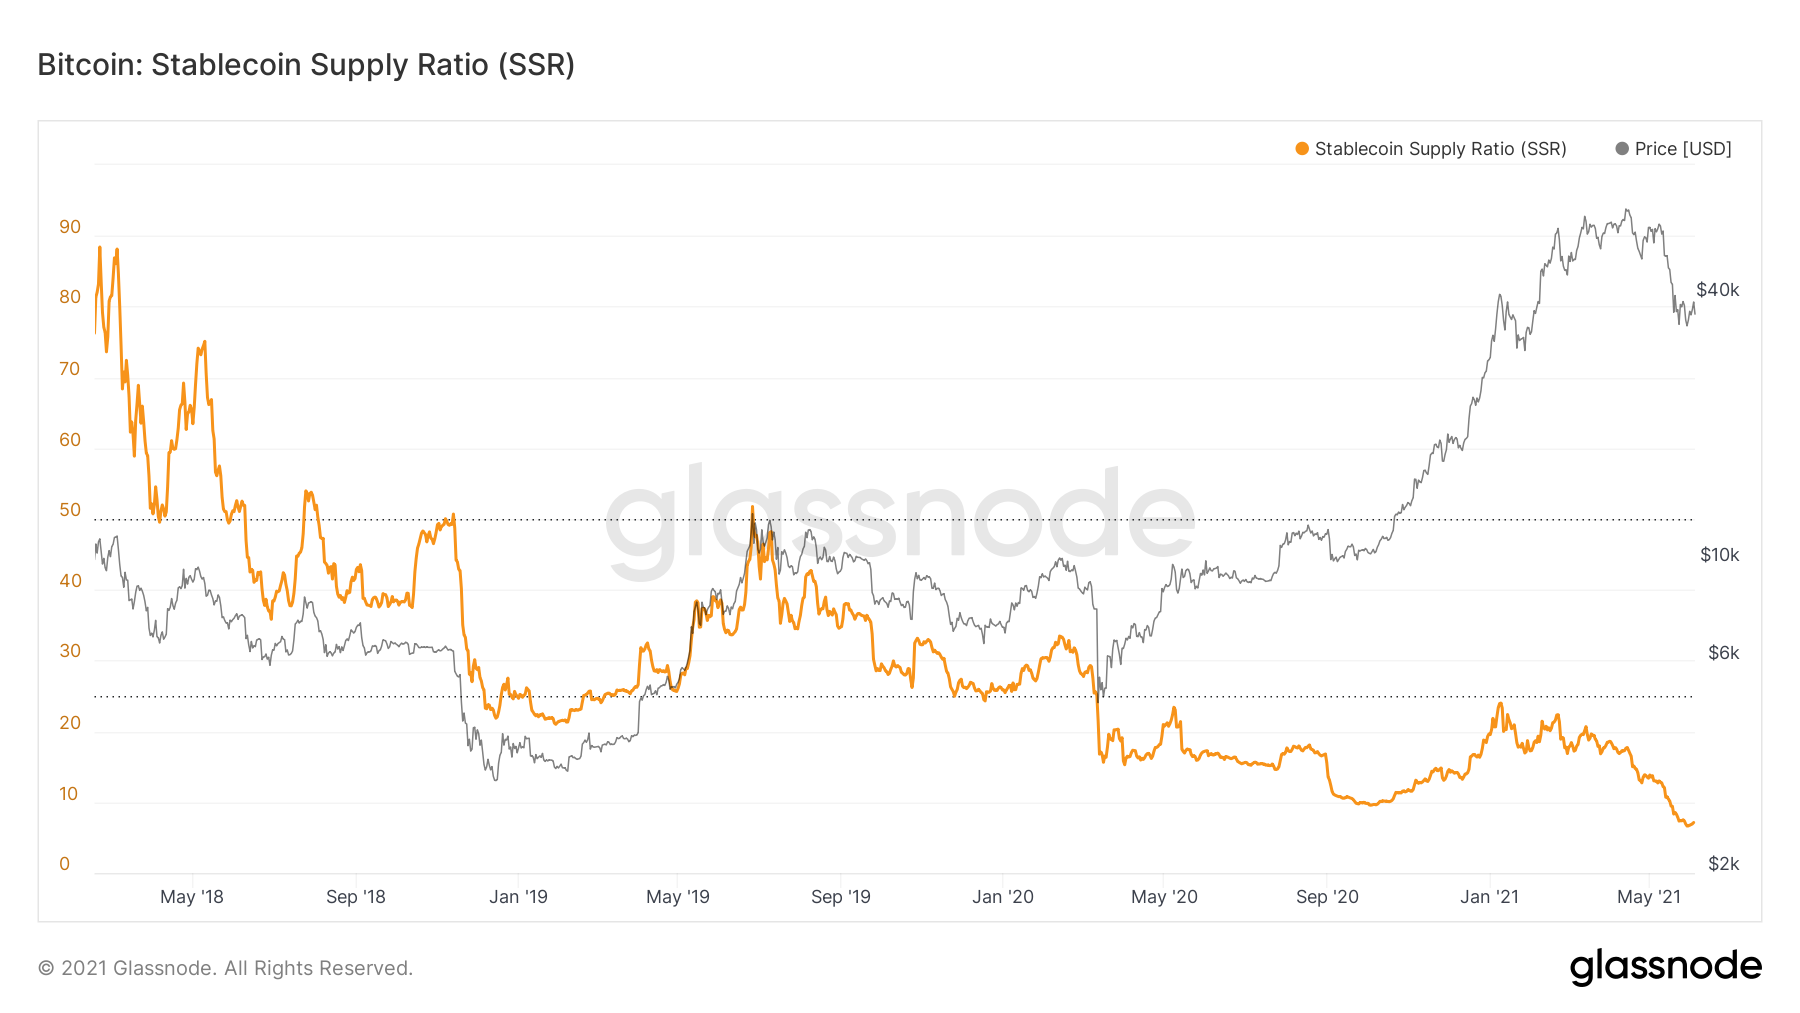
BTC SSR chart
Despite the crackdown on Bitcoin mining, miners seem to be holding strong and can be seen in the Miners Position Index (MPI). According to CryptoQuant, MPI is the ratio of BTC leaving all miners’ wallets to its 1-year moving average.
This indicator has stayed below zero since early March, suggesting that miners are not looking to sell their holdings any time soon.
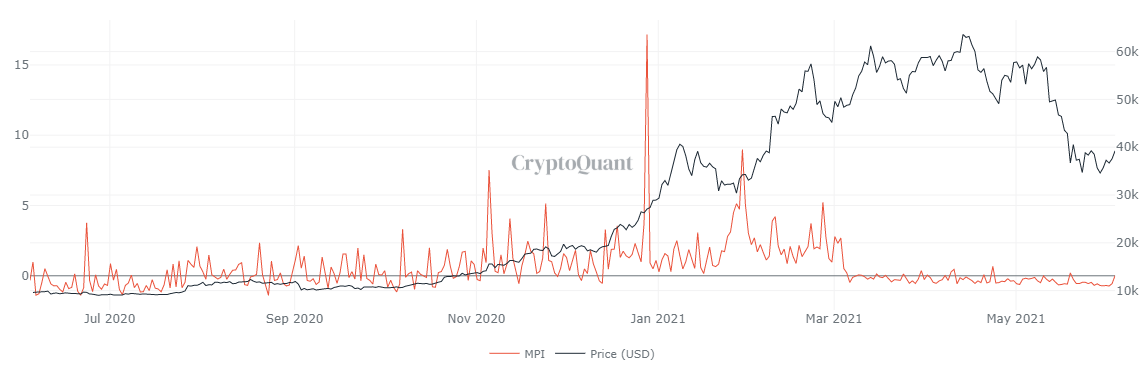
BTC MPI chart
Bitcoin’s network user growth metric shows a bullish bias since the number of new users joining the network increases despite massive drawdowns.
Typically, a reduction in this indicator would denote the start of a bear market. According to Willy Woo:
We are seeing new users taking the opportunity to buy Bitcoin for the very first time during this price dip. This is a key sign that we have NOT entered a bear market.
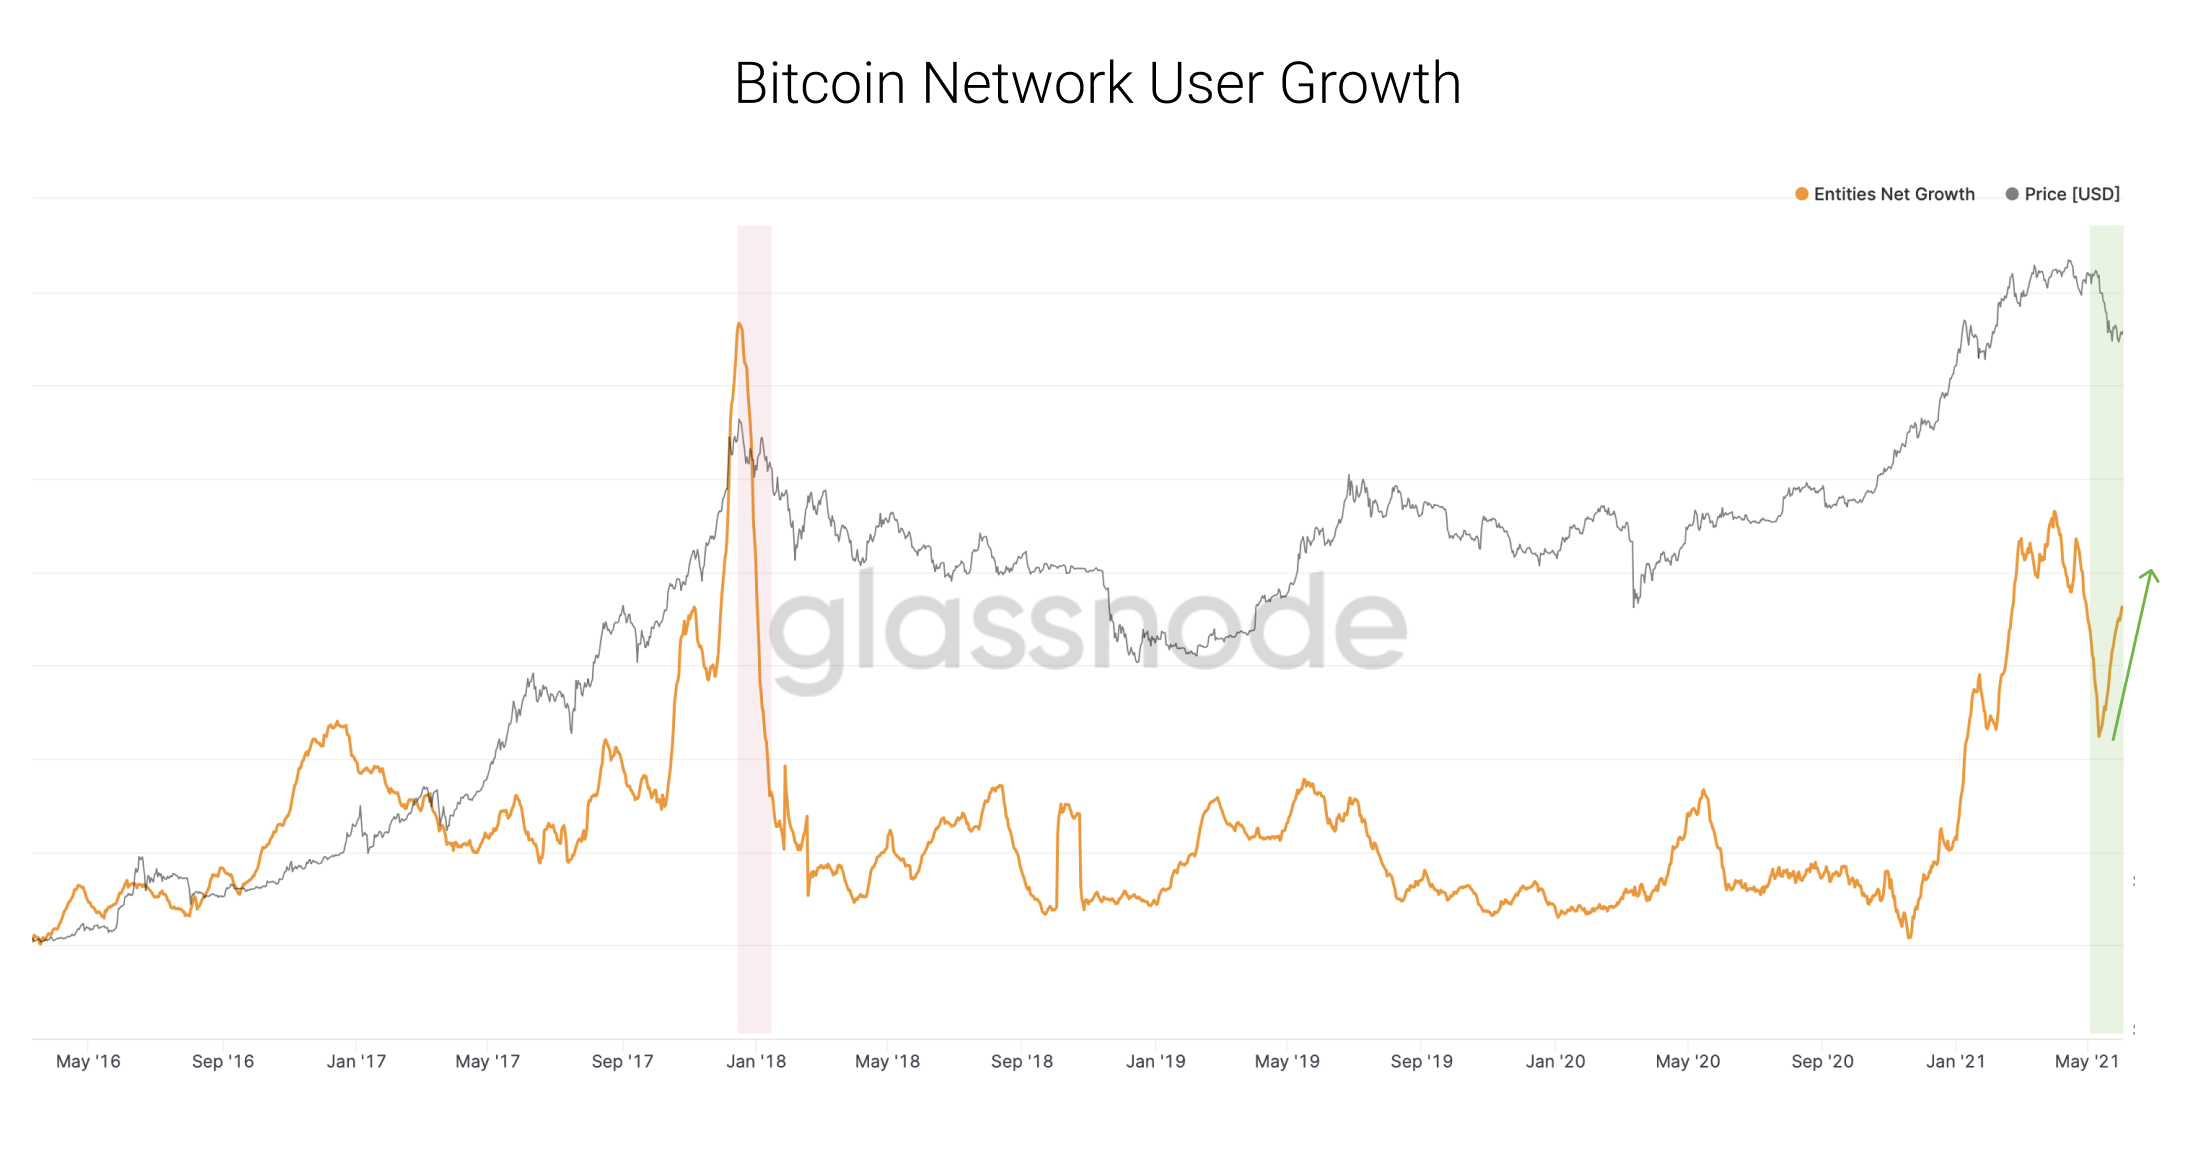
BTC network user growth chart
While the last week seemed extremely bearish, Bitcoin price has moved into an indecisive state. The immediate resistance level at $42,000 and the support barriers at $33,200 or 30,000 will play a pivotal role in determining the fate of Bitcoin price.
Therefore, investors need to exercise caution as BTC is consolidating and has not chosen a clear bias yet.
Author

Akash Girimath
FXStreet
Akash Girimath is a Mechanical Engineer interested in the chaos of the financial markets. Trying to make sense of this convoluted yet fascinating space, he switched his engineering job to become a crypto reporter and analyst.


