Bitcoin Weekly Forecast: BTC ready to tackle $60,000 as investors front-run ETF approval
- Bitcoin price is likely to correct to $50,000 or $48,000 after failing to hold above the 70.5% Fibonacci retracement level at $54,182.
- This descent will set the stage for a run-up to the next psychological level at $60,000.
- On-chain metrics reveal holders in profit have increased, supporting the short-term correction thesis.

Bitcoin price has positioned itself for a correction after the recent uptick in buying pressure. While the uptick made sense from a technical perspective, the rate of the uptrend did not and could be attributed to the renewed hype around the approval of a futures ETF.
Regulation plays catch-up with adoption
Bitcoin adoption in 2021 has been stellar. From increased usage of BTC in El Salvador to rising BTC ATM installations, the future for Bitcoin looks bright. Although the adoption began with retail, institutions have started taking a second look at BTC. A note shared by JPMorgan to its clients on October 7 revealed that these institutions are looking at BTC as a hedge against inflation instead of gold.
With such an increased interest in Bitcoin, the approval of a Bitcoin ETF makes sense, considering it will allow large investors to gain exposure to BTC without actually holding it. According to Bloomberg analysts, there is a 75% chance that the SEC will approve a futures Bitcoin ETF in October.
If true, this could trigger a bull run in Q4, allowing the ecosystem to recuperate after the May 19 crash. However, some whales do not want to wait or get left behind in the race.
CryptoQuant CEO Ki Young Ju tweeted that an investor(s) purchased “$1.6B worth $BTC via market orders in just 5 minutes.”
Popular analyst Alex Kruger suggested the cryptocurrency markets are trending higher due to the ETF anticipation.
This is what crypto markets are trading now. The dominant narrative is a bitcoin ETF. Dissapoint or not, can worry about that later. https://t.co/aIv3BFZqI4
— Alex Krüger (@krugermacro) October 6, 2021
Where there is heightened interest, there is regulation. Likewise, due to the recent spike in Bitcoin and crypto investments, the US Justice Department recently announced the launch of cryptocurrency cops dubbed the National Cryptocurrency Enforcement Team.
Elaborating on this matter, Deputy Attorney General Lisa Monaco stated,
Cryptocurrency exchanges want to be the banks of the future. We need to make sure that folks can have confidence when they’re using these systems, and we need to make sure we’re poised to root out abuse that can take hold on them.
Bitcoin price to personify the phoenix metaphor
Bitcoin price rose a whopping 37% from September 29 to October 6 as it went from $40,750 to $55,800. Although BTC closed above the 70.5% Fibonacci retracement level at $54,182 on the daily chart, the following daily candlestick closed below it, suggesting investors are booking profits.
The Momentum Reversal Indicator (MRI) also flashed a red ‘one’ sell signal on this candlestick, indicating that the rally is overextended and a one-to-four candlestick correction is likely. Investors can expect this correction to retest the $50,000 psychological support level; a breakdown of this barrier will lead the big crypto down to the demand zone ranging from $43,716 to $48,834.
A bounce off of this area will likely cause the markets to reset, allowing buyers to scoop up BTC at a discount. Market participants can expect the reignited bull rally to shatter through $50,000 and make a run at the 79% Fibonacci retracement level at $57,269 and eventually the $60,000 psychological level.
A decisive close above this barrier will push BTC to retest the all-time high to $64,895 and, perhaps, a new one if the buying pressure persists.
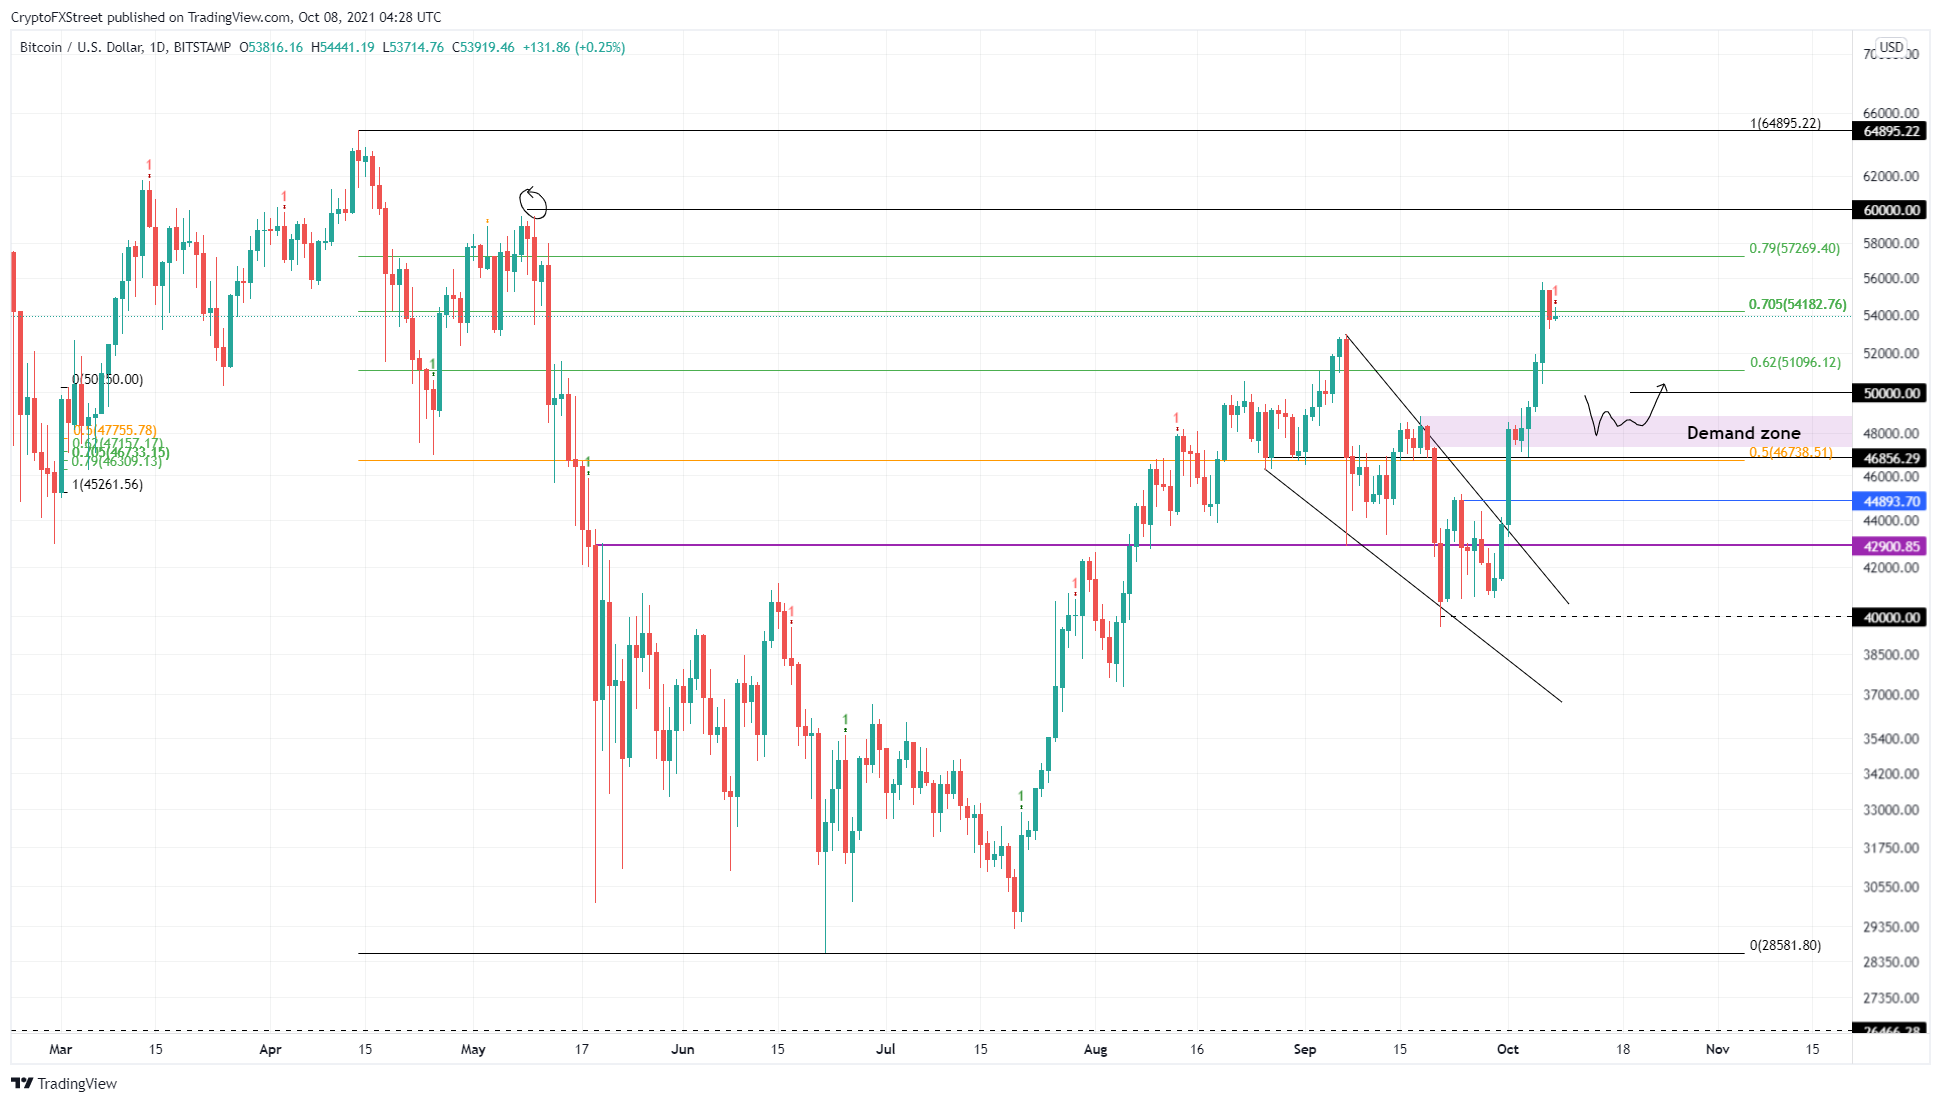
BTC/USD 1-day chart
Supporting the short-term correction is the 365-day Market Value to Realized Value (MVRV) model, which is hovering around 25.21%. This on-chain metric is used to calculate the average profit/loss of investors that purchased BTC over the past year.
Therefore, the BTC network shows that 25% of the buyers that purchased BTC are in profit, increasing the risk of a sell-off if these holders book profits.
 [14.44.16, 08 Oct, 2021]-637692812617002159.png)
BTC 365-day MVRV chart
Revealing the long-term bullish outlook for Bitcoin are the daily active addresses, which are increasing. Interestingly, BTC’s price has set up lower highs since September 7, but the active addresses have created higher highs. This forking is referred to as the bullish divergence and indicates that the interest among investors interacting with the Bitcoin blockchain is increasing.
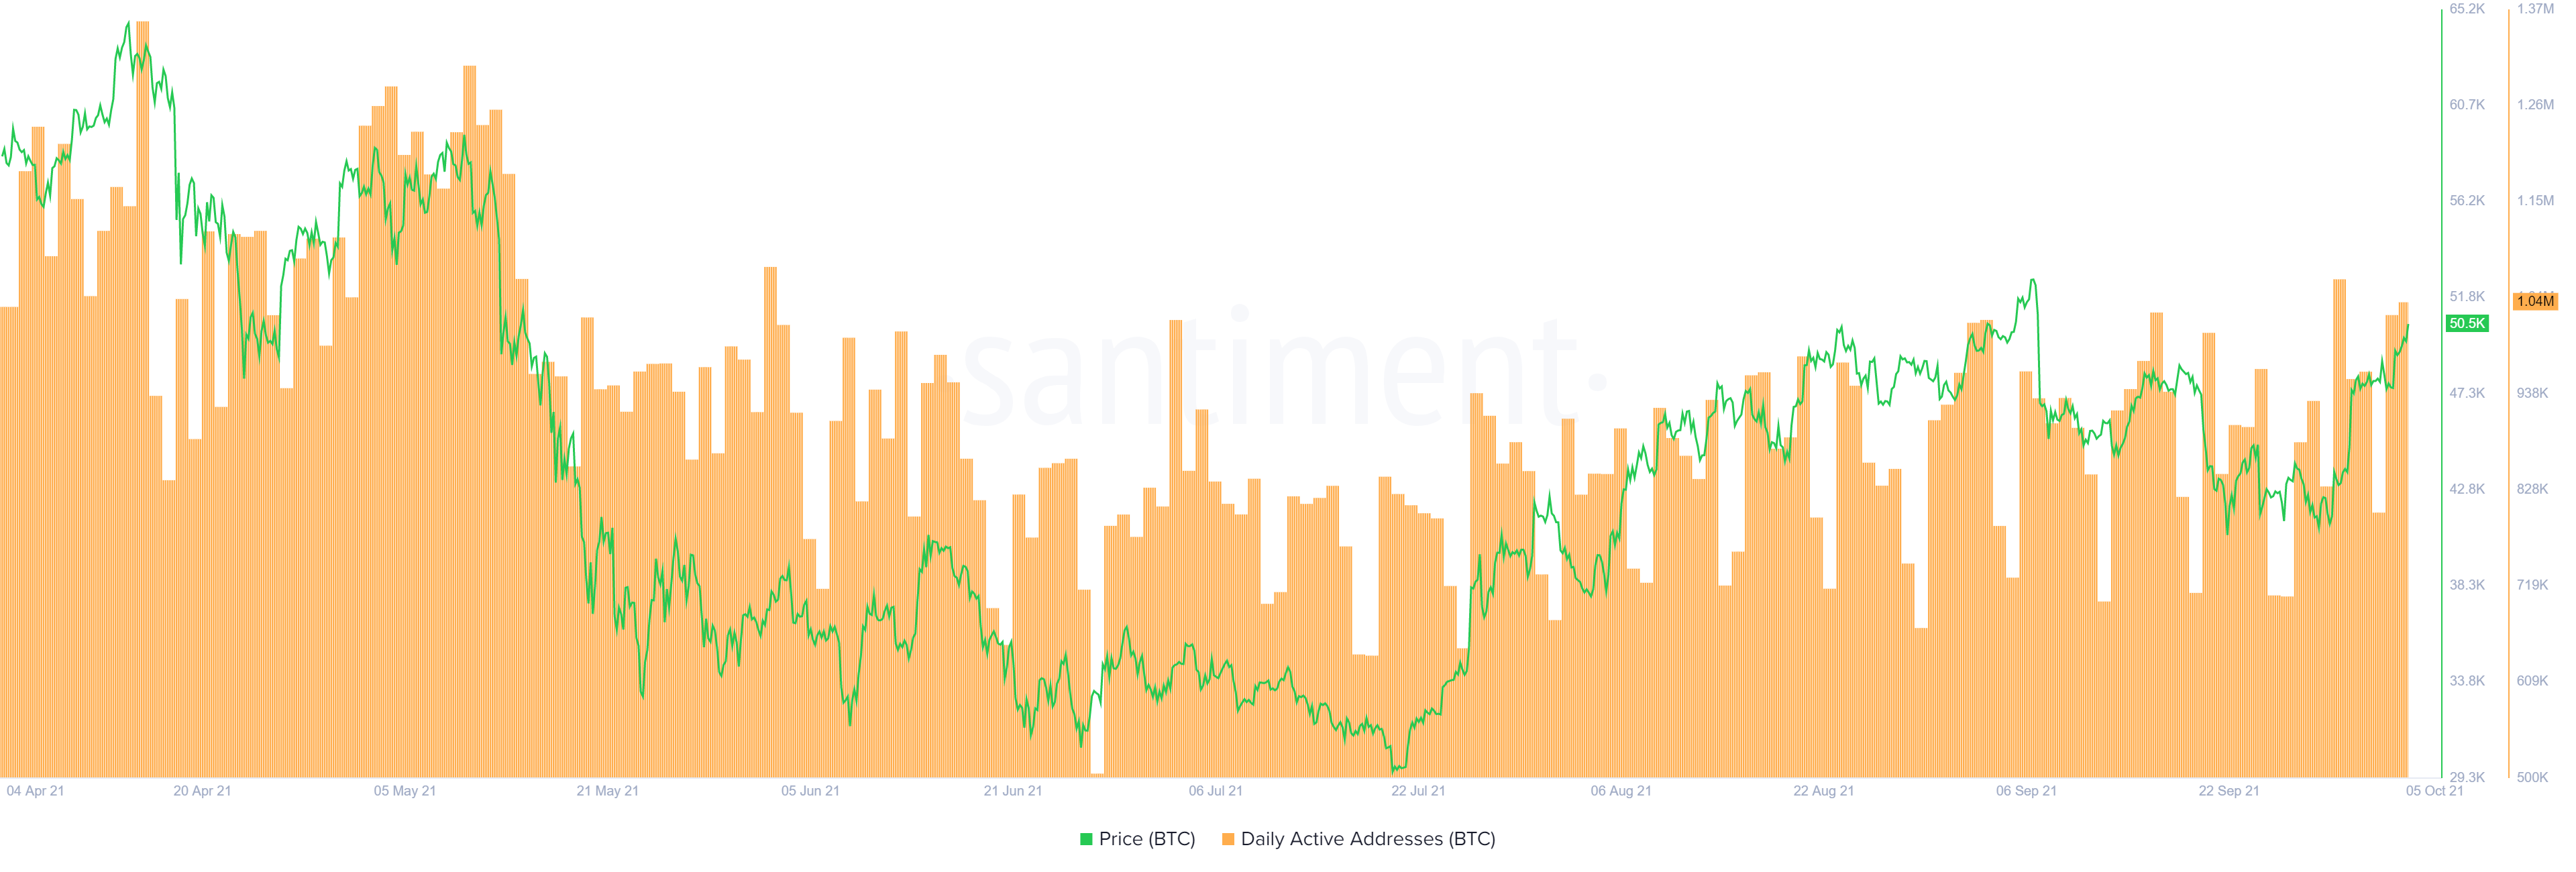
BTC DAA chart
Additionally, the Whale Ratio metric has dropped to 0.43, indicating that the long-term outlook is bullish without any risk of a significant sell-off. CryptoQuant defines this on-chain model as the relative size of the top 10 inflows to total inflows for all exchanges.
An increasing Whale Ratio indicates that whales are depositing their holdings to exchanges looking to book profits. Therefore, the recent decline hints at a bullish outlook.
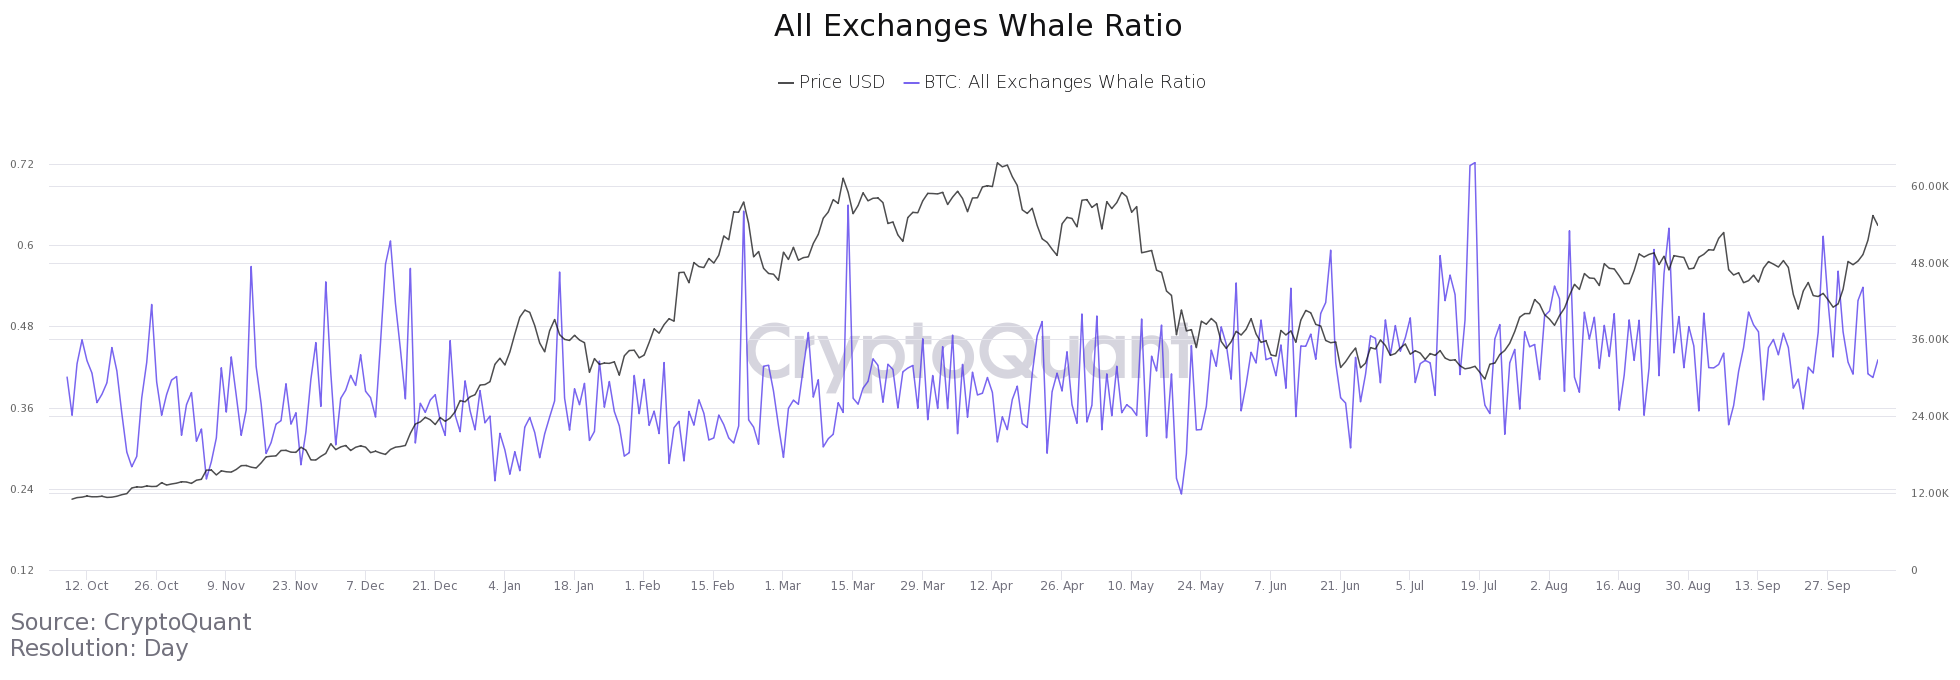
BTC Whale Ratio chart
While things are looking good for Bitcoin price a breakdown of the demand zone ranging from $43,716 to $48,834 will be a bad development. However, a decisive close below the 50% Fibonacci retracement level at $46,738 will create a lower low and invalidate/delay the upswing.
In this case, BTC will likely revisit the $44,893 foothold before taking another jab at a bull rally.
Author

Akash Girimath
FXStreet
Akash Girimath is a Mechanical Engineer interested in the chaos of the financial markets. Trying to make sense of this convoluted yet fascinating space, he switched his engineering job to become a crypto reporter and analyst.


