Bitcoin Weekly Forecast: BTC pauses 2023 rally, big picture remains bullish
- Bitcoin price struggling to decide direction for next move, hovers around $29,247-to-$41,273 breaker.
- A spike in buying pressure could push BTC deeper into bearish breaker, tag its mean at $35,260 or upper limit at $41,273.
- On the other hand, a failure to muster up momentum could see it slide into the $22,591-to-$26,591 area.

Bitcoin (BTC) price has remained flat as it encountered the weekly resistance via a bearish breaker area. Despite multiple rejections on the daily and the four-hour timeframes, BTC bears have not been able to take control of the price action.
Read more: Arthur Hayes argues ‘capital gets destroyed over time’ in traditional finance, predicts $1 million Bitcoin
Bitcoin price remains lull
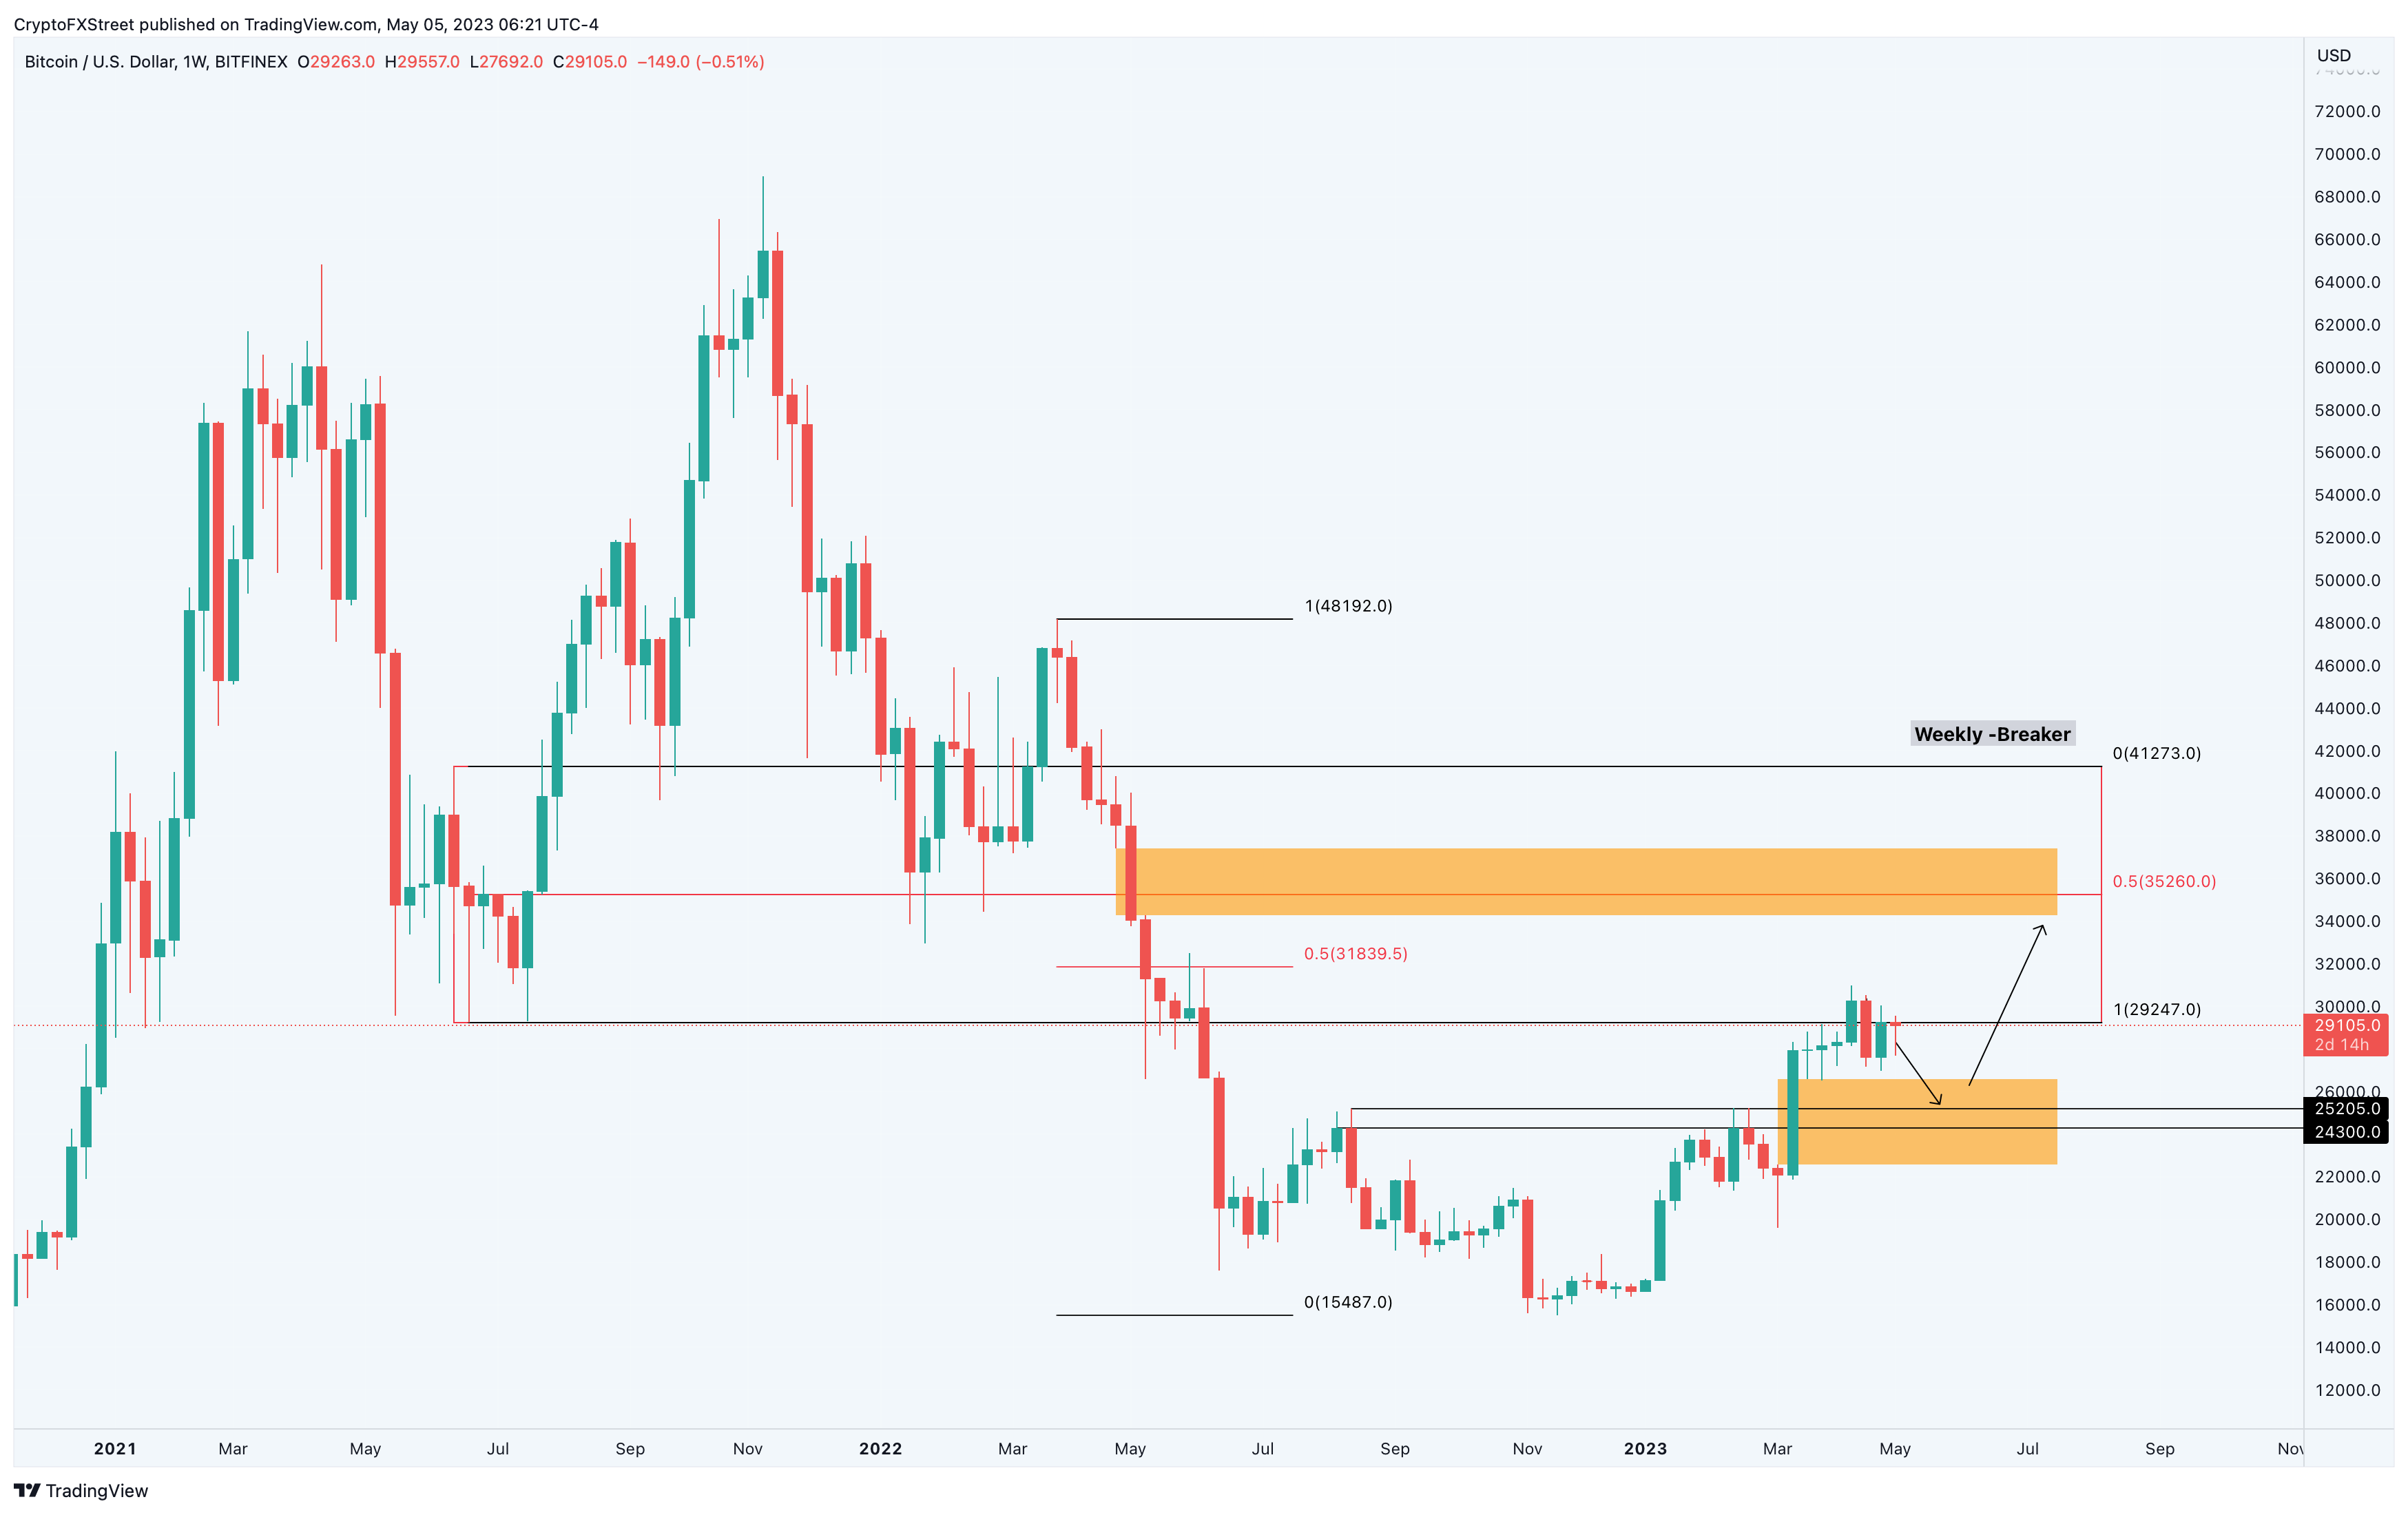
Bitcoin price has been hovering around the $29,247to-$41,273 bearish breaker’s lower limit for four weeks. With no directional bias and range tightening, things are starting to look boring for BTC traders.
Nevertheless, investors need to note that there is a good chance that Bitcoin price will continue heading higher until it tags the midpoint of the bearish breaker at $35,260. In a highly bullish case, a retest of the breaker’s upper limit at $41,273 is also possible.
With the Federal Reserve (Fed) latest 25 basis points hike, the financial landscape of the United States tightens even further. As more banks collapse, the trust in the Fed and the fiat currency will slowly start to erode. This development will push more people into hard assets like Gold, or even Bitcoin.
For more information about bearish breakers, read this: Where will the 2023 crypto bull rally top? – ICT
The premise of the 2023 bull rally is a side effect of the collapse of popular banks like Signature, Silicon Valley Bank, and more. This week, we have seen JP Morgan taking over First Republic Bank and other US regional banks like Western Alliance or Zions Bancorp experience big sell-offs in the stock markets on their financial troubles.
Although the momentum of the uptrend might have slowed down, leading to a consolidation in Bitcoin price, things are likely to continue ifthe right catalyst triggers a panic buying of BTC.
BTC/USDT 1-week chart
A deeper look into BTC technicals points at key buying area
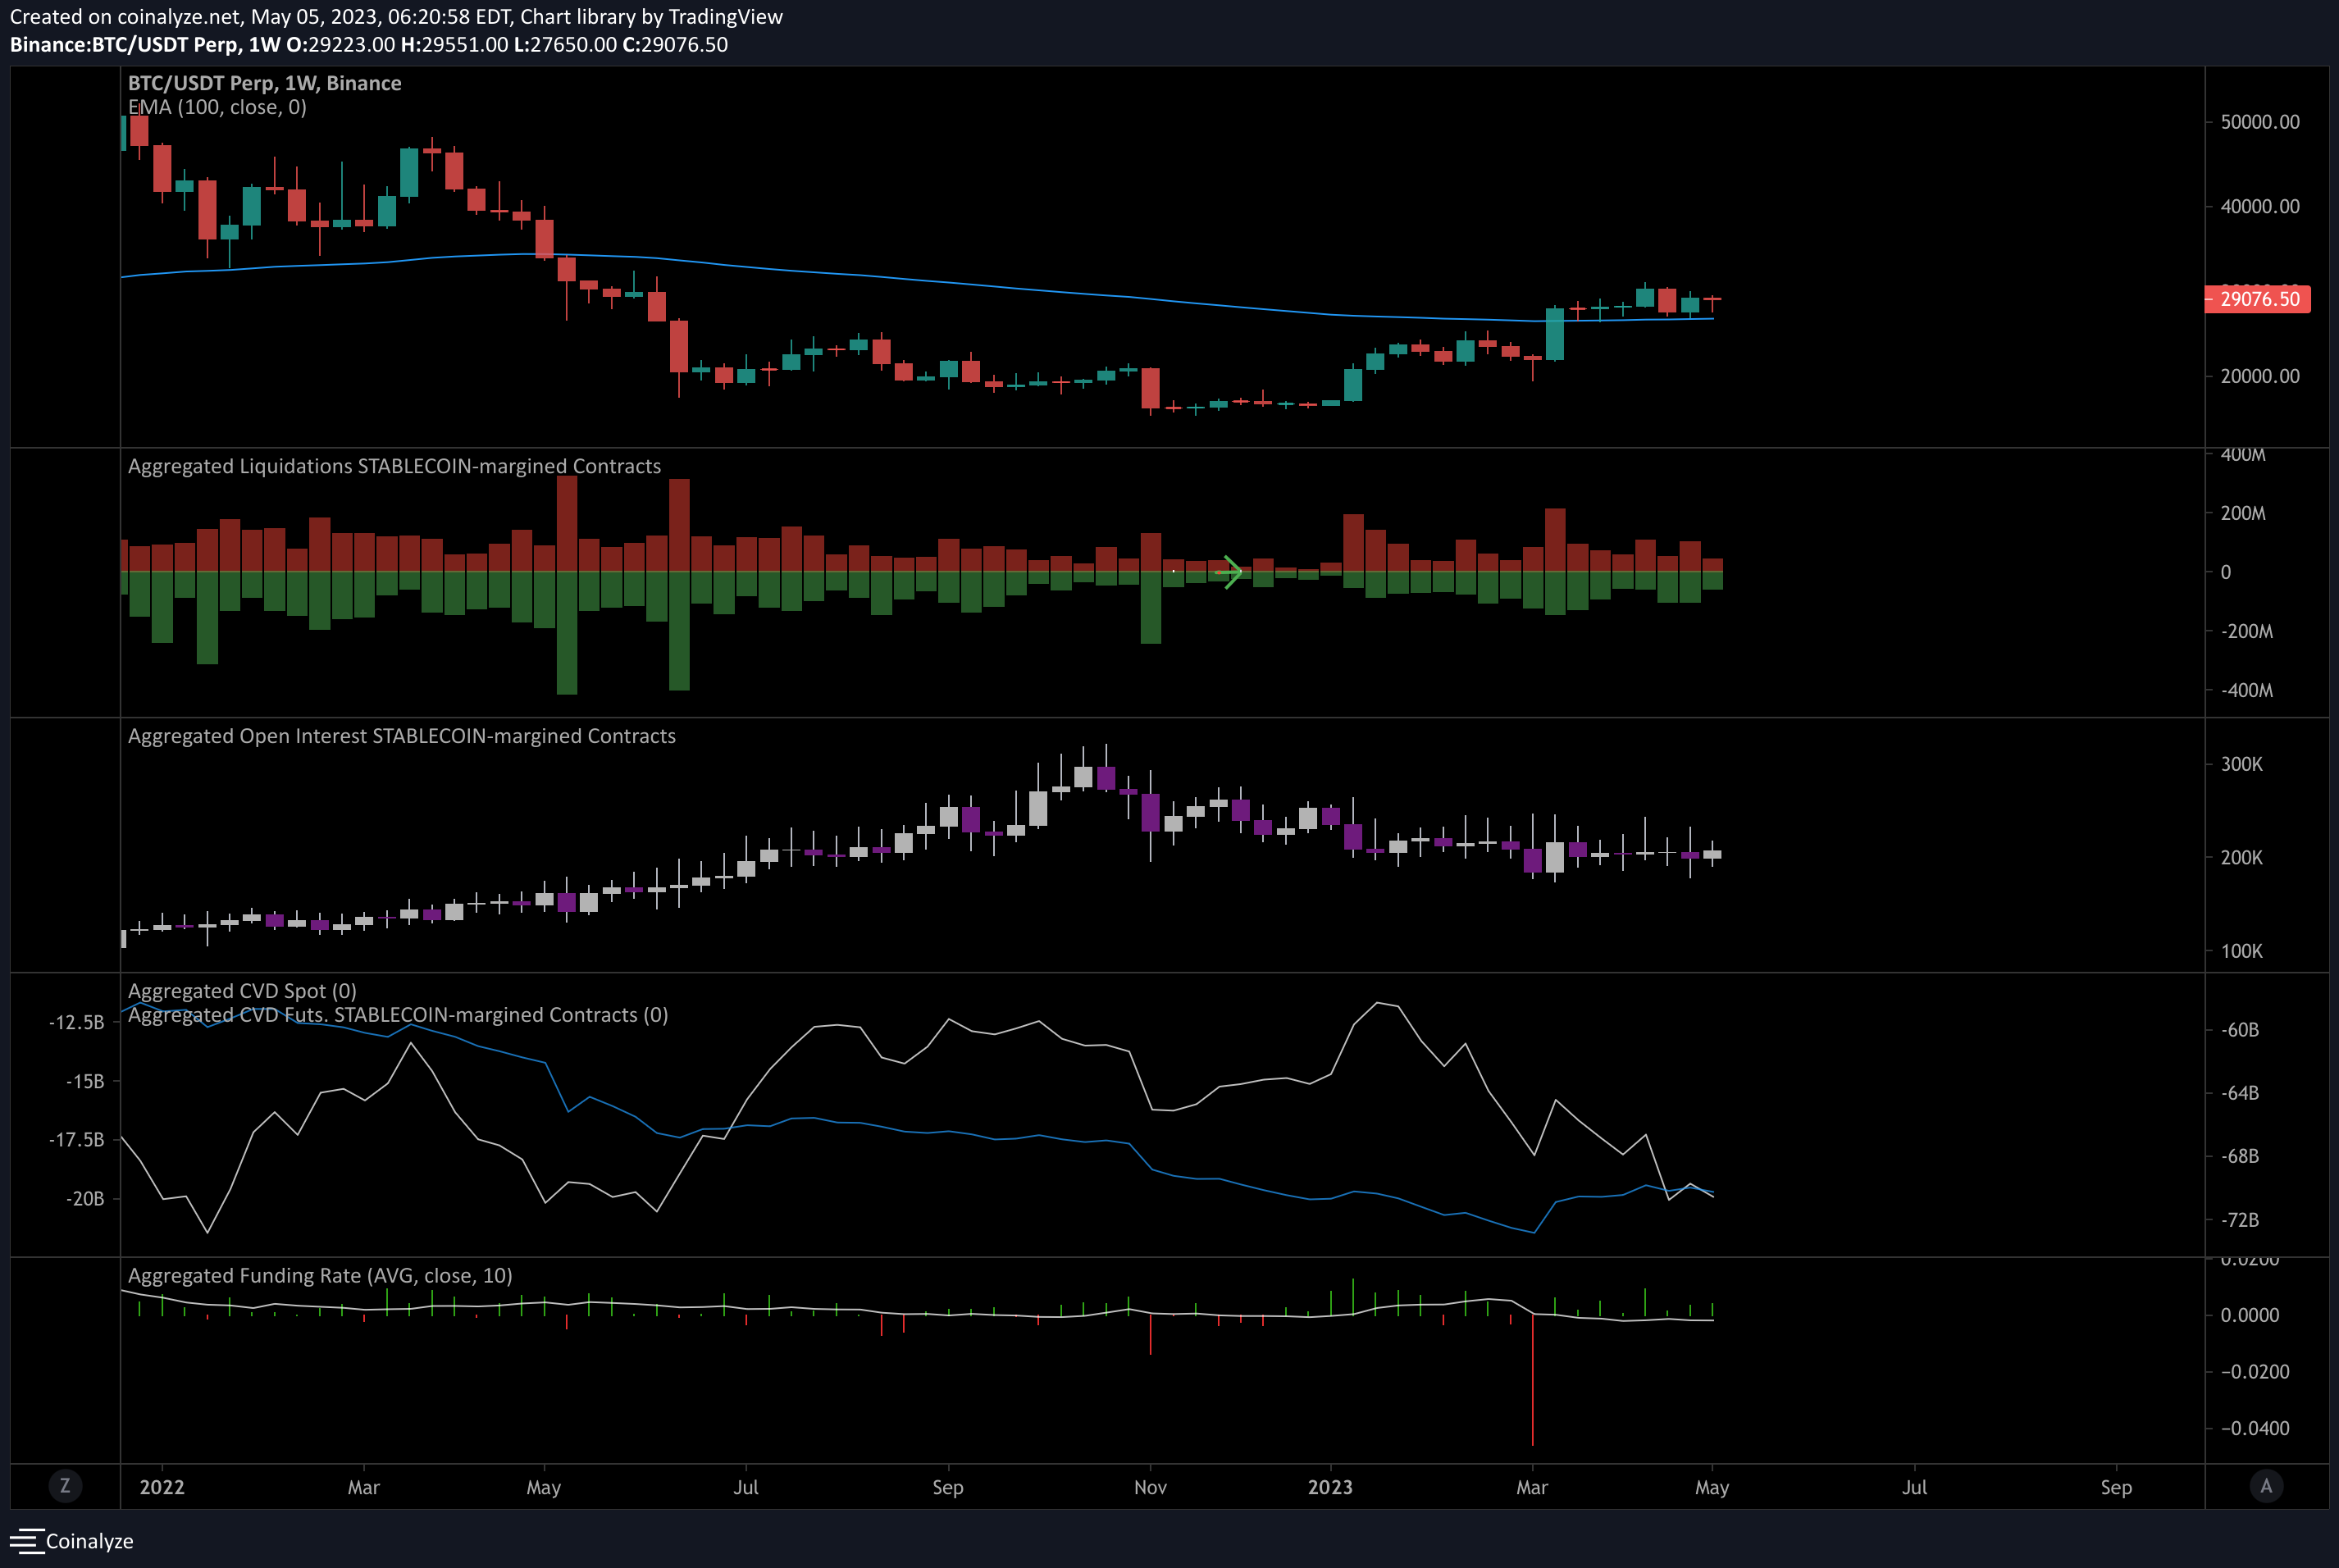
To know more about the health of Bitcoin investors, let us take a look at the open interest, liquidations, funding rate, and discrepancy between buying and selling volumes.
The chart attached below shows that Bitcoin price has sliced through the 100-week Simple Moving Average at $26,600 and is sitting comfortably above it, denoting a bullish outlook.
The declining open interest, which denotes the number of open positions combined with collapsing spot and derivatives volume delta, suggests that short sellers are dominant. Additionally, long liquidations seem to be the most affected, which is in line with other metrics, suggesting a bearish outlook for now.
A stark increase in the Open Interest followed by an uptick in spot and derivatives volume delta would be the first sign of a budding uptrend.
BTC/USDT 1-week chart
While the outlook for Bitcoin price suggests a short-term pause in the uptrend, it is unsure to predict if BTC will continue heading higher before re-testing the Fair Value Gap (FVG), extending from $22,591 to $26,591. A move into this area will deliveran opportunity for long-term holders to accumulate BTC.
For more information on FVG read this: Where will the 2023 crypto bull rally top? – ICT
Inside this FVG are two stable support levels at $25,205 and $24,300, which are ideal places for purchasing BTC.
Author

Akash Girimath
FXStreet
Akash Girimath is a Mechanical Engineer interested in the chaos of the financial markets. Trying to make sense of this convoluted yet fascinating space, he switched his engineering job to become a crypto reporter and analyst.


