Bitcoin Weekly Forecast: Assessing the chances of BTC visiting $30,000
- Bitcoin price has shown incredible strength over the last nine days, rallying from $18,889 to $24,305.
- If the momentum persists, this move could extend to significant levels between $25,000 and $30,000.
- On the other hand, a breakdown of the $21,710 support level will invalidate this bullish expectation.

Bitcoin price has noticed a large shift in sentiment from being overly bearish to optimistic. Although greed is still out of the equation, things could soon reach these levels, especially if the trend continues as it has over the last ten days.
Bitcoin price and the prevailing dichotomy
Bitcoin price has shattered through the $17,578 to $21,710 range as it rallied 28% between July 13 to July 20. This move has also pushed past the $22,844 resistance level and is currently flipping it into a support barrier.
The chances of BTC continuing this trend to reach the $25,000 psychological level are relatively high, especially if Bitcoin price manages to stay above $22,844. In some cases, this rally could extend to the overbought zone, extending from $26,768 to $29,287.
This area is likely where Bitcoin price will form a local top. Any move beyond this level would be highly unlikely, due to the resistance levels present above.
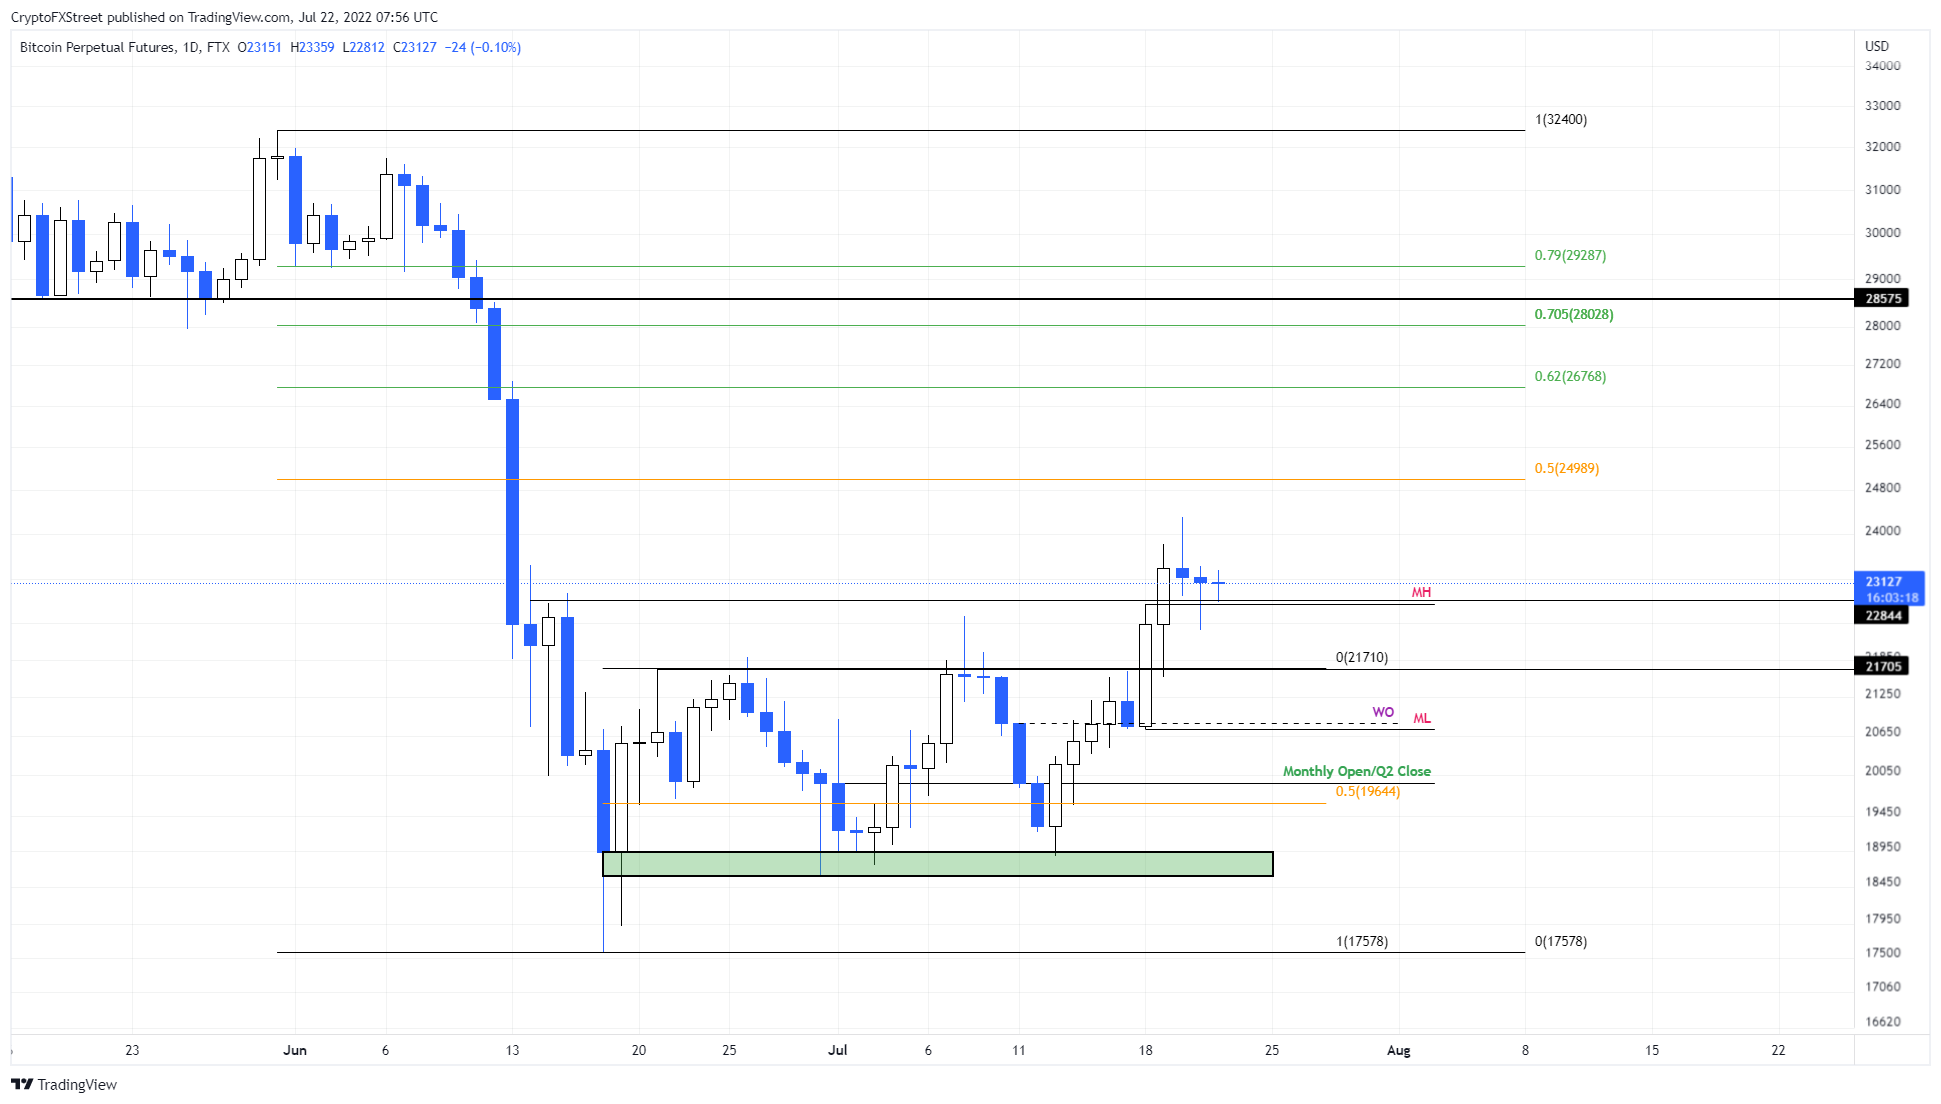
BTC/USDT 1-day chart
While this optimistic outlook makes sense, things could turn ugly for Bitcoin price and its investors if this bullish momentum exhausts. If BTC bears take over and produce a daily candlestick close below the $21,710 support level, it will invalidate the aforementioned scenario.
Clearly, this development would be bad for investors that purchased BTC, since it would indicate that the recent run-up was just a deviation above the $17,578 to $21,710 range.
However, for futures traders, this move is an opportunity to short.
The first level that investors need to pay close attention to is Monday’s low at $20,750, which roughly coincides with the weekly open at $20,845. If the bearish momentum is strong, this downswing could retest the $19,644 barrier, aka the range’s midpoint.
The resting place for bears would be after a dip into the liquidity pool, extending from $18,601 to $18,941. Here, buyers can regroup and attempt another leg-up.
In some cases where the selling pressure sees a massive spike, this correction could turn into a sell-off that sweeps below the range low at $17,578.
The dark side of BTC’s bearish narrative
In the 1-week chart attached below, investors can note that a major support level that has prevented Bitcoin price from crashing is $19,065. This barrier is a high-volume node aka a place where a large volume of BTC was traded in 2019.
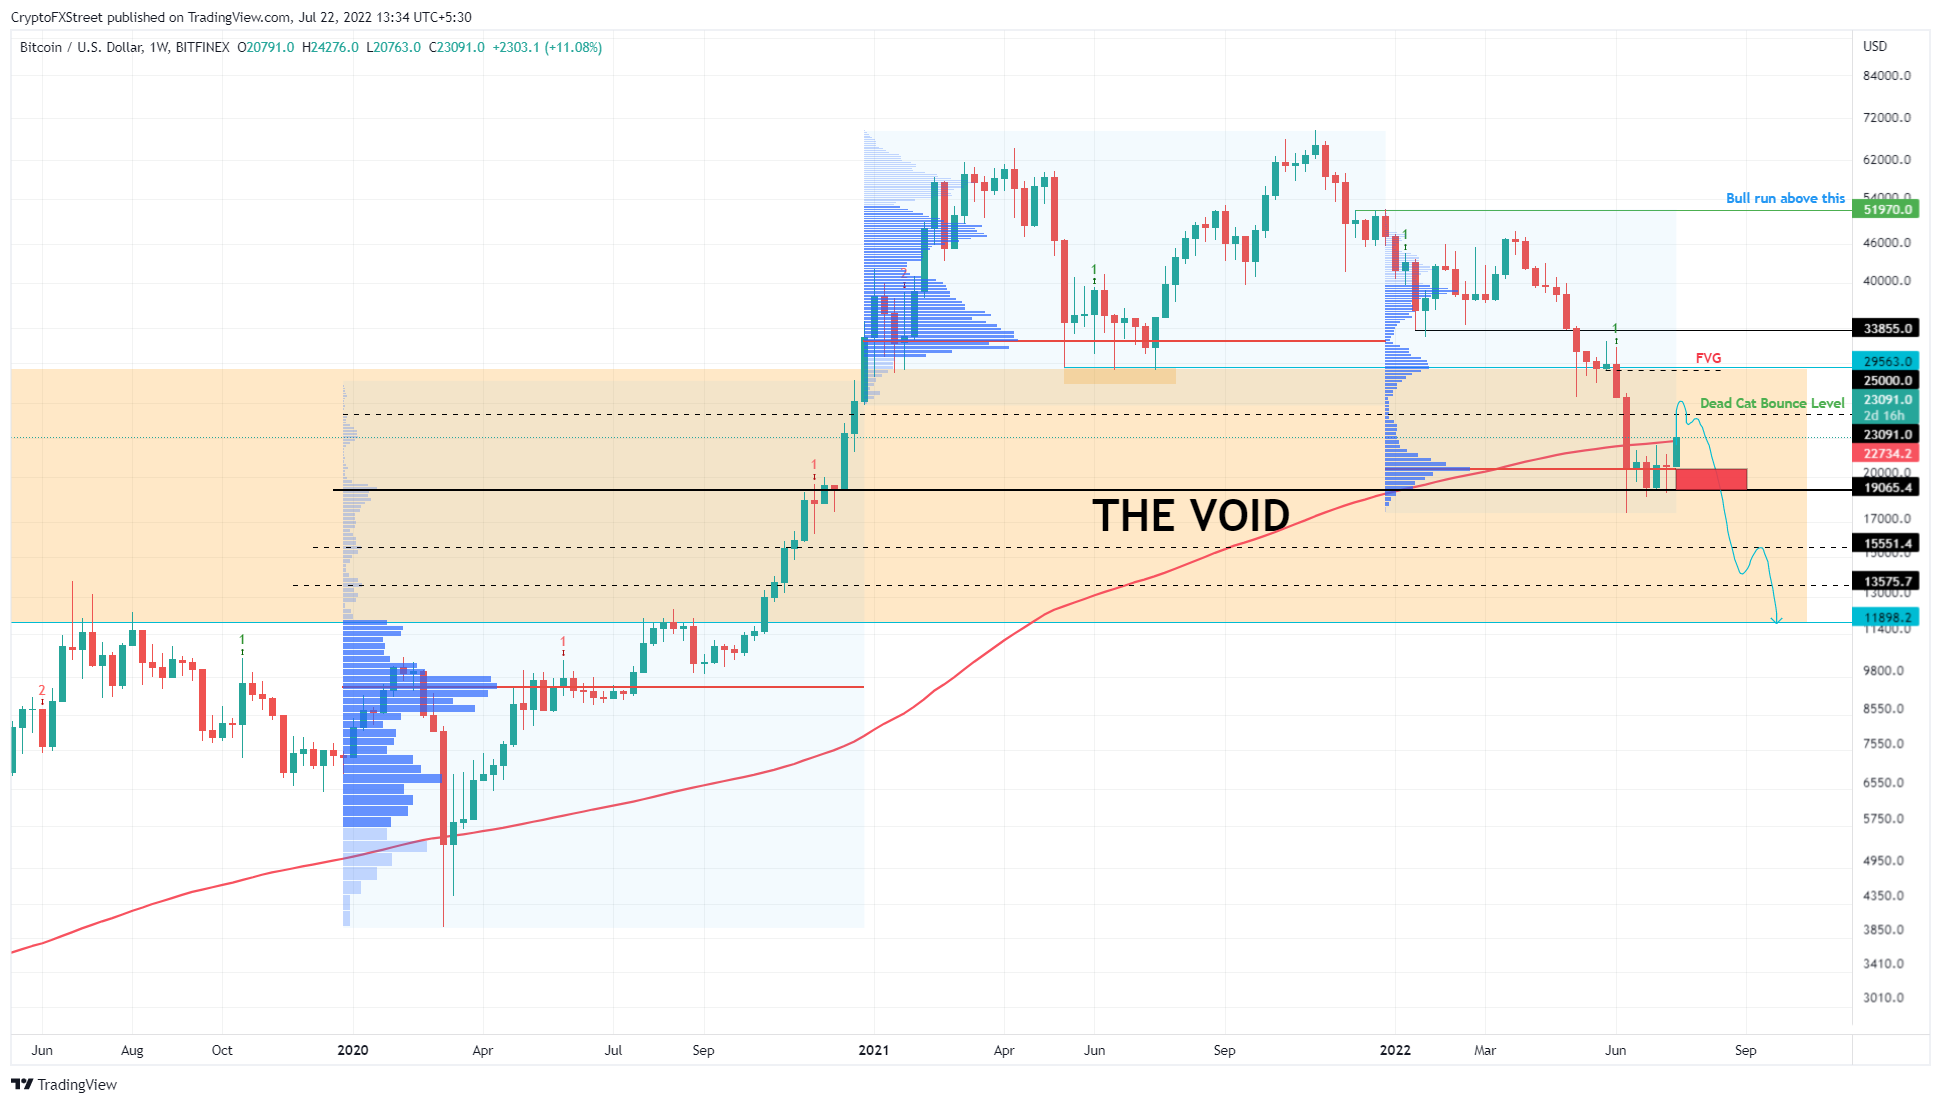
BTC/USDT 1-week chart
Due to the recent price action, Bitcoin price has created a volume point of control at $20,661. This level is the point at which the highest volume of Bitcoin was traded in 2022 and will serve as a stable support level. So, in conclusion, if the bears produce a weekly candlestick close below the $19,065 support level, either on a daily or weekly time frame, it would indicate that things are about to get worse.
In this case, Bitcoin price could slide to the lower end of the Void at $11,898 with minor support levels at $15,551 and $13,575.
Author

Akash Girimath
FXStreet
Akash Girimath is a Mechanical Engineer interested in the chaos of the financial markets. Trying to make sense of this convoluted yet fascinating space, he switched his engineering job to become a crypto reporter and analyst.


