Bitcoin Weekly Forecast: Assessing shift in BTC’s narrative and critical levels to watch
- Bitcoin price rallied 30% in 2023, causing investors to question if a bull run has begun.
- Some on-chain metrics indicate a shift in paradigm and hint at an incoming rally, but others need to mature.
- Many similarities can be drawn to the recent run-up compared to 2019’s mini bull run.

Bitcoin (BTC) price shows a clear surge in buying pressure that has shifted the landscape from bearish to bullish, albeit for the short term. Regardless, investors are cautious and torn between discerning what phase of the cycle BTC is in.
In this article, let us explore a few on-chain metrics to get a bigger picture of the market cycle.
Bitcoin price strikes a bullish chord
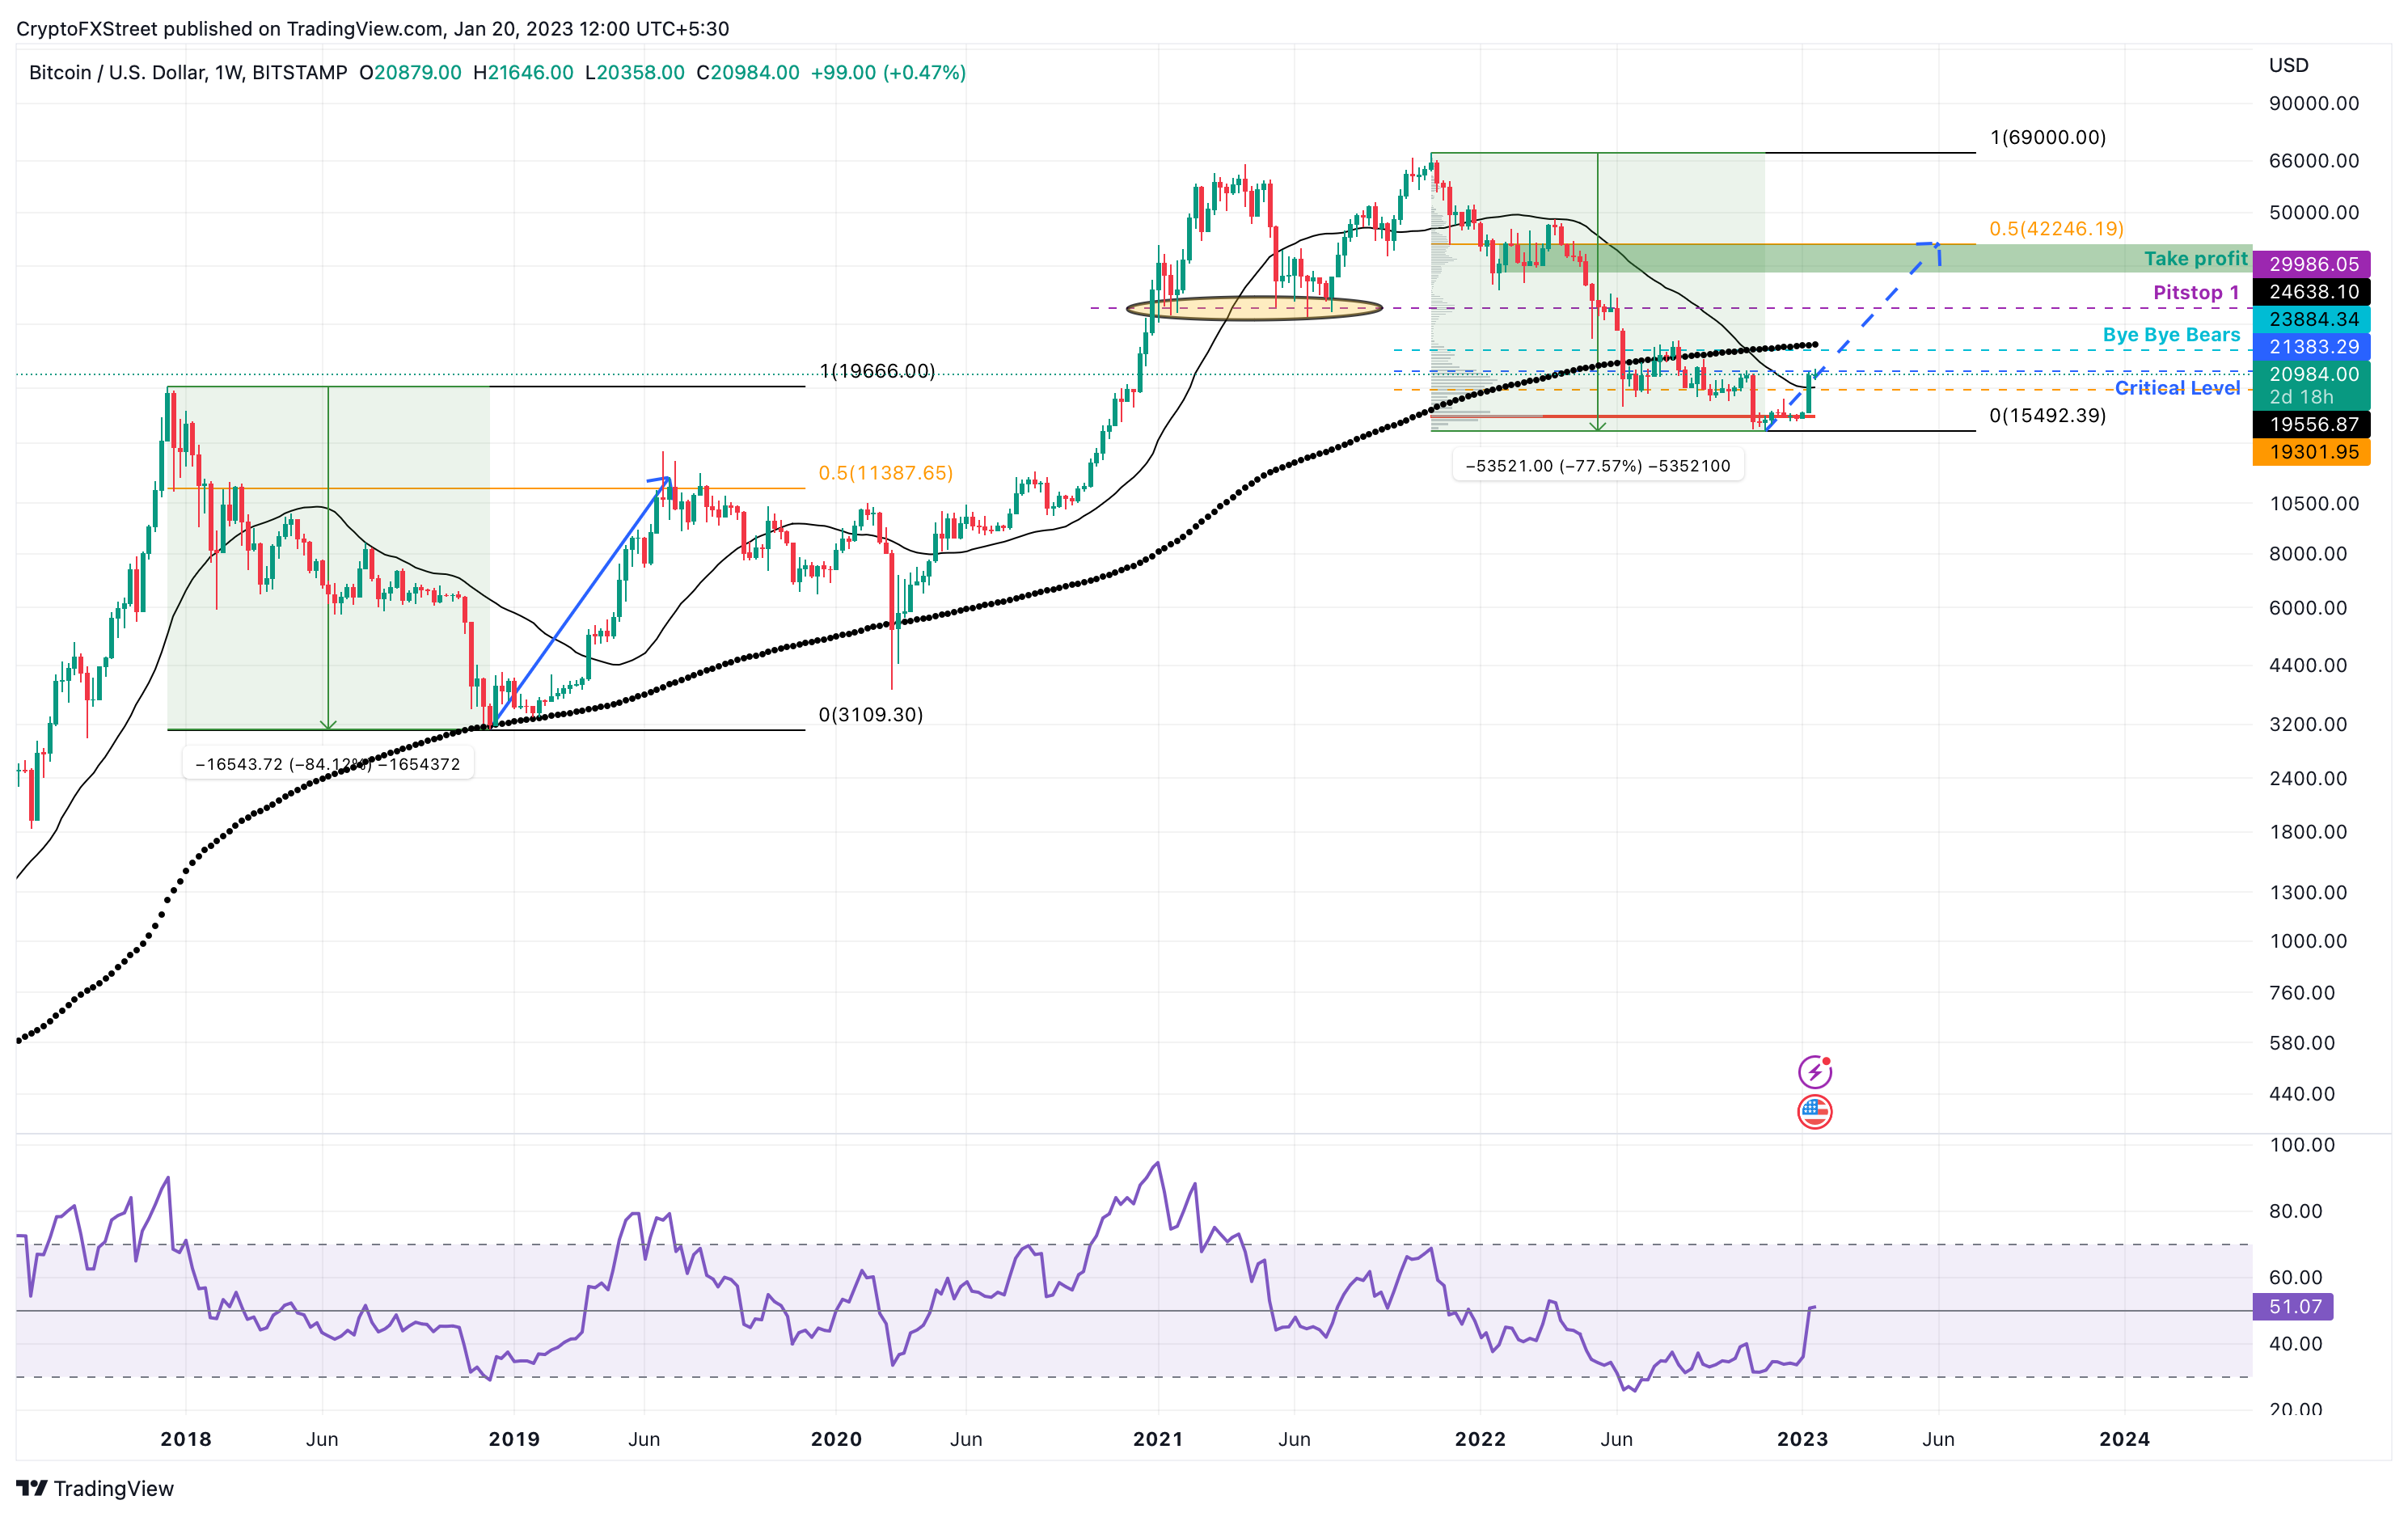
Bitcoin price has rallied 24% altogether, reflected in the long green weekly candlestick starting on January 9. This explosive run-up has some major implications that have pushed investors into confusion. While some are outright bullish and expect a bull rally, others are still bearish, and some are cautiously optimistic.
From a purely technical standpoint, Bitcoin price will need to overcome the $21,400 and $23,900 horizontal resistance levels to stand a chance at reaching $30,000 or higher levels. Adding the 200-day and 200-week Simple Moving Averages (SMAs) to the mix gives a much better picture.
Although Bitcoin price has overcome the 200-day SMA at $19,556, it still needs to face the 200-week SMA at $24,638 hurdle.
If these aforementioned levels are overcome, BTC will have a higher chance of revisiting the $30,000 hurdle or the resistance zone, extending from $36,260 to $42,450. Interestingly, the $42,450 resistance level is the midpoint of the 77% crash Bitcoin price underwent between November 2021 and November 2022.
Looking back at the price of Bitcoin in 2018 and 2019, the current situation seems oddly familiar. After an 83% crash from December 2018 to December 2019, BTC quickly rallied to the midpoint of this slump at $11,387.
If history were to repeat itself, then a mean reversion play will put Bitcoin price at roughly $42,450.
BTC/USDT 1-day chart
Supporting factors for bulls
The recent spike in Bitcoin price has changed two aspects from an on-chain perspective. The first one is the move above the level of an on-chain metric called the Realized Price of BTC, which has pushed the average holders of the largest crypto to be profitable.
Realized price is the average cost basis at which Bitcoins were purchased. It is obtained by dividing the value of Bitcoins at the price they were bought by the number of Bitcoins in circulation.
Ideally, if a clean break above this metric holds, it will signify the start of a bull run for Bitcoin price. It can be noted that in the 12-year history of BTC, the 2022-2023 bear market has spent a total of 179 days below the realized price. Compared to the previous cycles, the current duration spent in the bear market is the second longest duration across the last four bear cycles.
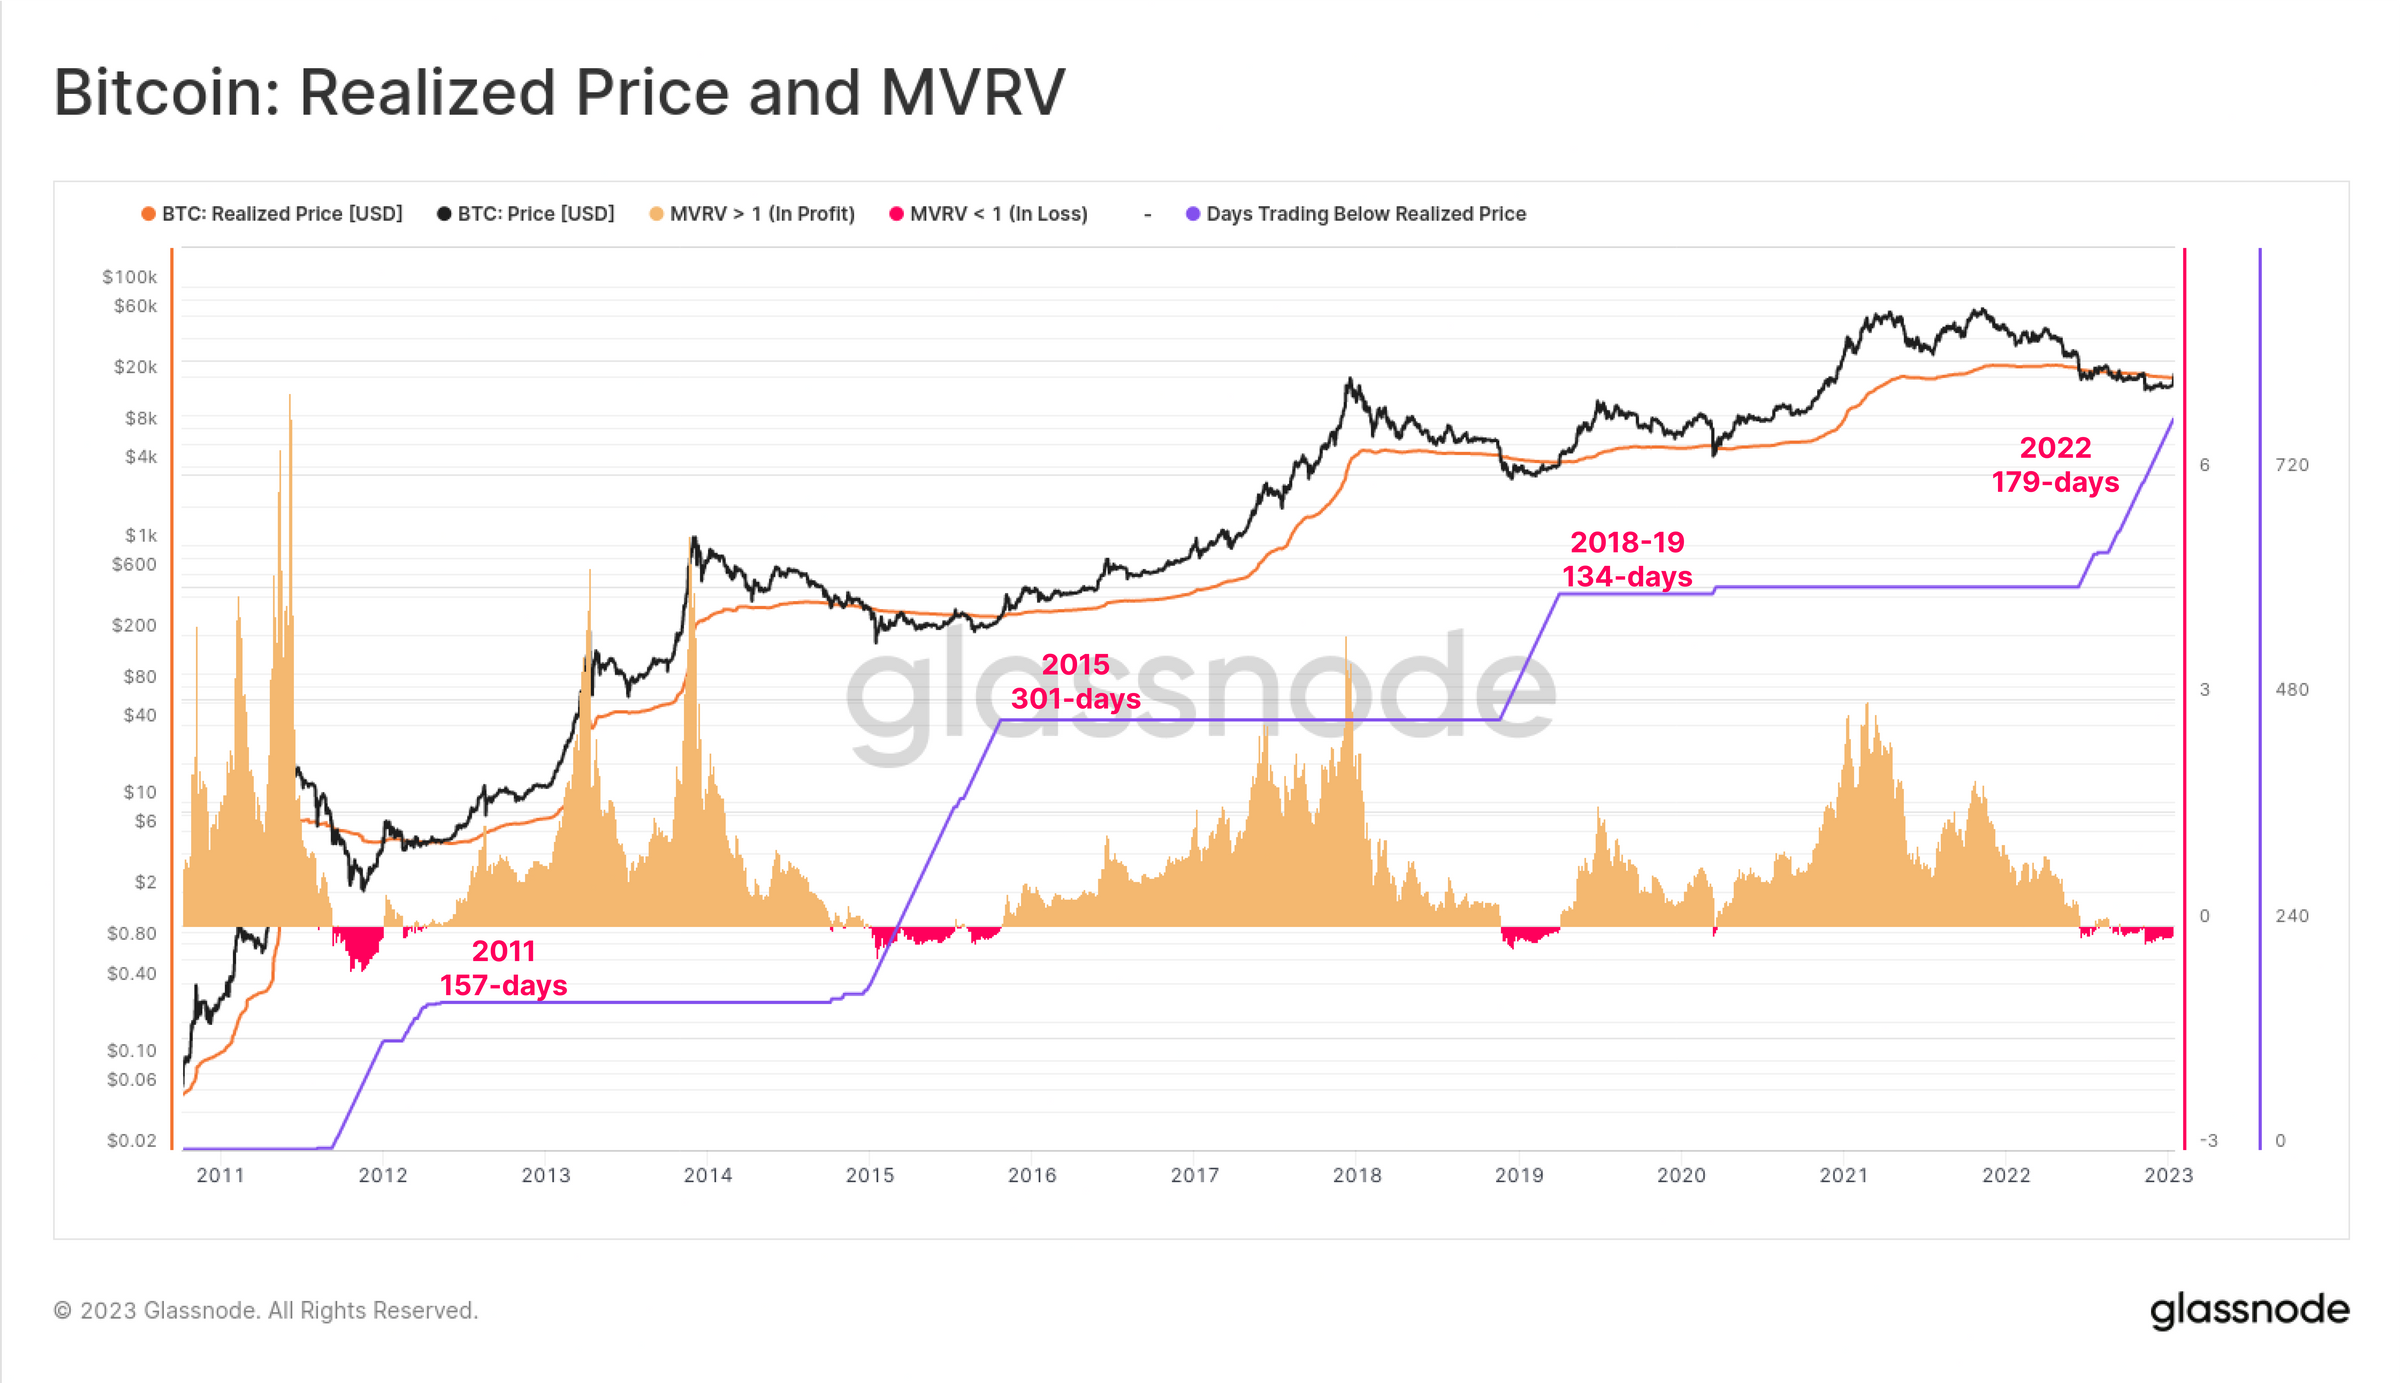
BTC realized price and MVRV
The realized price can be further broken down into two parts - the long-term holder realized price, which tracks the coins that have been held for at least 155 days and the short-term holder realized price which counts coins that changed hands in the last 155 days.
So far, the long-term, short-term and realized price bands converged in September 2022, which is something that usually happens in bear markets with massive price drops. However, the recent run-up has pushed Bitcoin price above the Realized Price of short-term holders at roughly $18,000. For long-term holders’, however, the breakeven price is much higher at around $22,400.
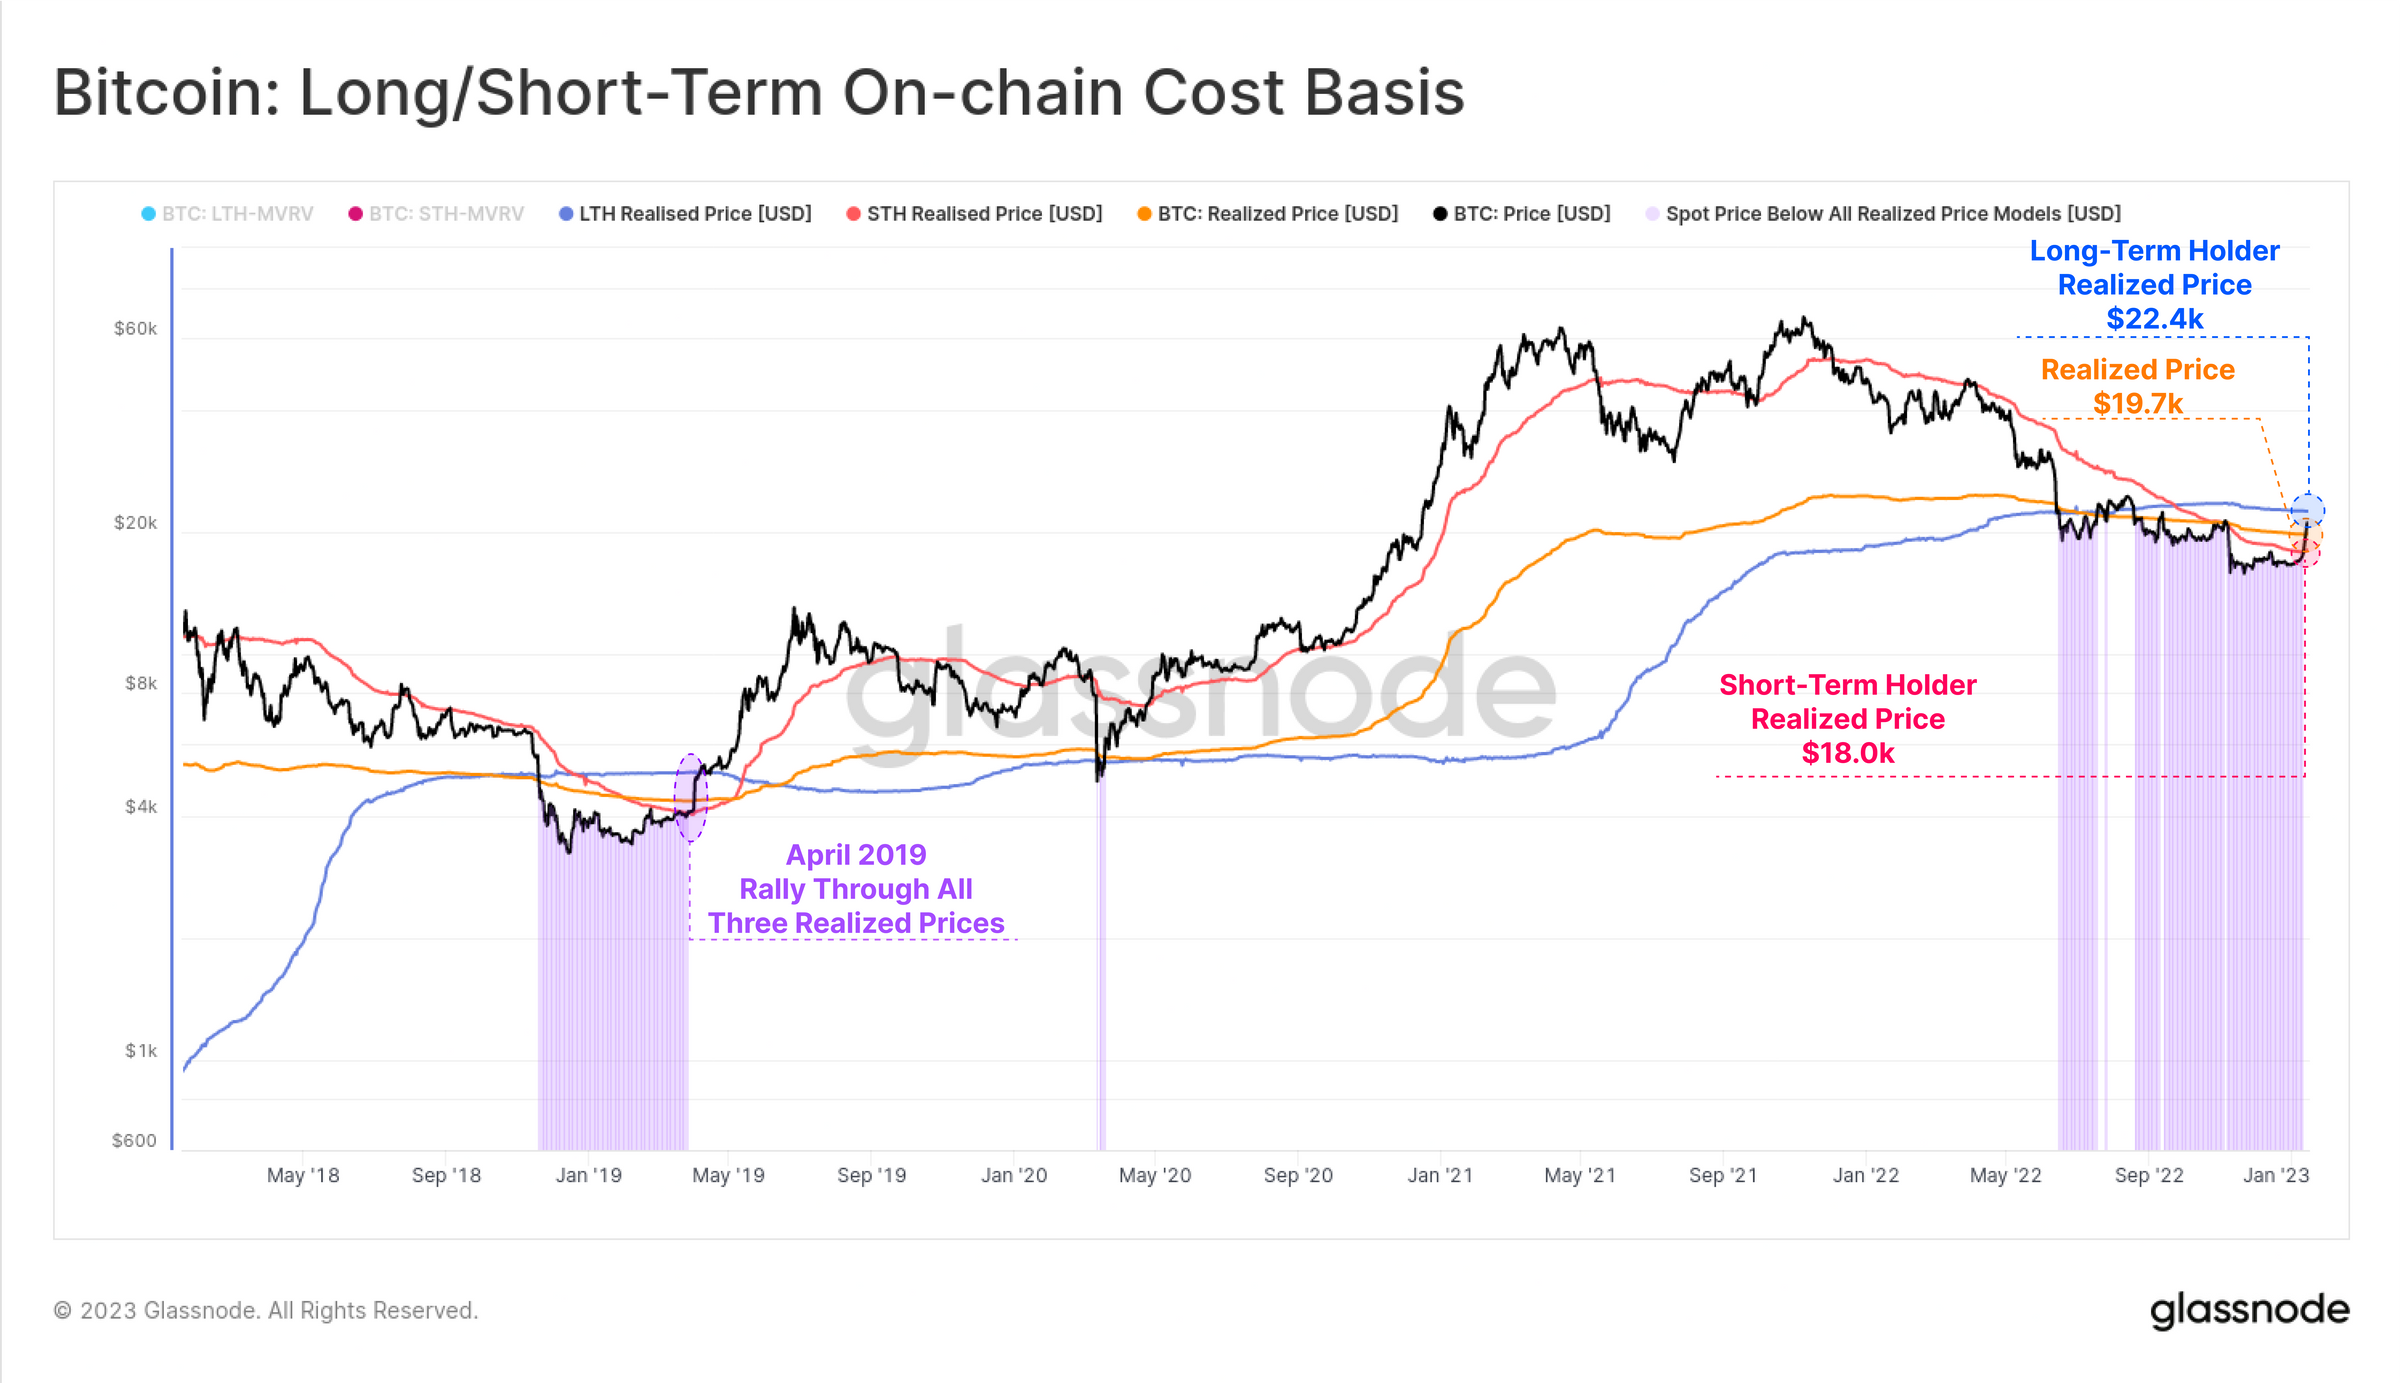
BTC LTH/STH cost basis
So, all in all, Bitcoin price faces multiple challenges if it wants to keep its bull run going. Especially up to $25,000. Beyond this hurdle, there is room for bulls to recuperate and attempt a push to $30,000 in a conservative outlook.
In the most optimistic scenario, the short-term uptrend could seize $42,246, which is the midpoint of the 77% crash in 2022.
The bear case and its outcomes
Looking at the Relative Strength Index for Bitcoin price on the weekly chart, things start to become dichotomous. From being confused about the bull or bear case, investors get an idea of how things could proceed on the weekly chart.
The RSI is currently facing the midpoint at 50, which is acting as a resistance level. The index dipped below this level roughly 400 days ago when Bitcoin price hit an all-time high in November 2021. Although the indicator attempted a flip in March 2022, it failed.
A clean flip of this hurdle will indicate the presence of bulls. A rejection, however, will clearly indicate the exhaustion of buying pressure and a potential sign of a retracement. In such a case, Bitcoin price will likely return to $19,300.
Failure to hold above this support structure will resume the long-term downtrend, which has produced two distinctive lower highs in November 2021 and March 2022. Invalidation of the bullish outlook will occur if Bitcoin price produces a weekly candlestick close below $15,492.
In such a case, Bitcoin price could revisit $11,387, which is the midpoint of the 88% crash witnessed between December 2017 and 2018.
Author

Akash Girimath
FXStreet
Akash Girimath is a Mechanical Engineer interested in the chaos of the financial markets. Trying to make sense of this convoluted yet fascinating space, he switched his engineering job to become a crypto reporter and analyst.


