Bitcoin Weekly Forecast: $50,000 on the horizon if it breaks below key support level
- Bitcoin price is testing the key support level at $56,000; a close below could see BTC’s downtrend persist.
- US spot Bitcoin ETFs registered outflows this week, totaling $536.1 million.
- Lookonchain data show that institutions and whales are selling their BTC holdings.
- On-chain data shows a bearish picture, with falling daily active addresses, long-to-short ratio below one, and decreasing Coinbase premium index.

Bitcoin (BTC) price tests the key support level at $56,000 on Friday, consolidating over a 1% decline this week. If it drops below this support, a continued downtrend is likely for BTC, as suggested by substantial outflows from US spot Bitcoin ETFs, rising institutional selling, and bearish on-chain indicators.
US spot Bitcoin ETFs see outflow, and institutions sell-off
Institutional flows didn’t support Bitcoin price this week. According to Coinglass data, US spot Bitcoin ETFs experienced outflow until Thursday, totaling $536.1 million in net outflows; this outflow has continuously occurred since August 27.
Net flows can help gauge investors’ sentiment toward Bitcoin. If the outflow continues, the Bitcoin price could decline further. The total Bitcoin reserves currently held by the 11 US spot Bitcoin ETFs are $42.26 billion.
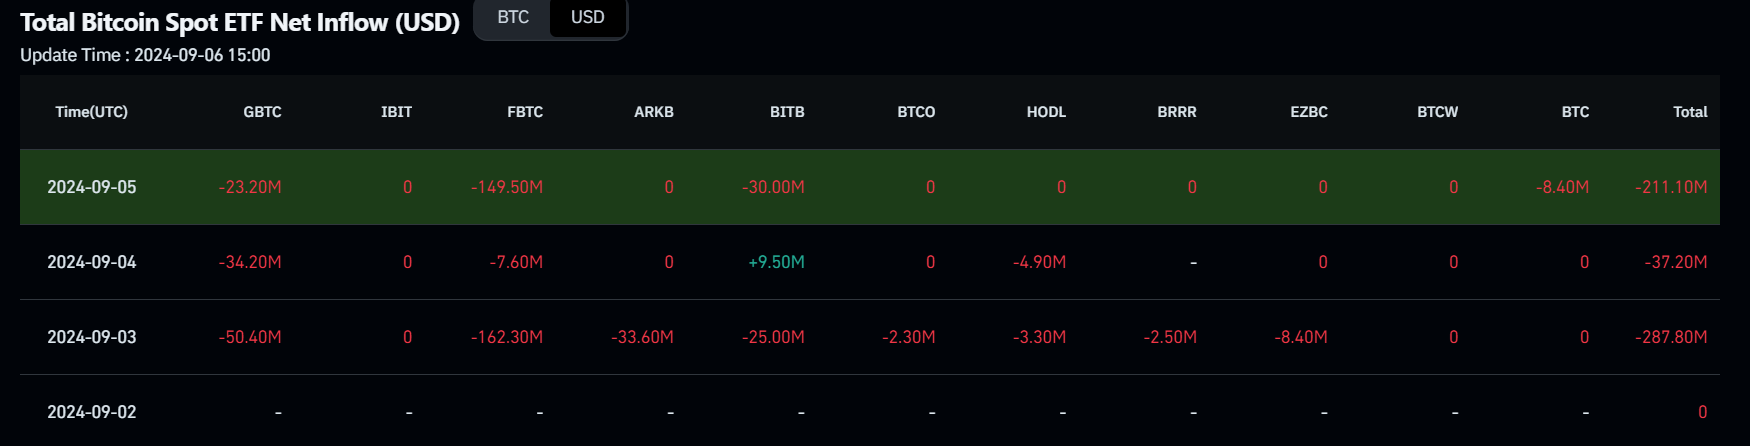
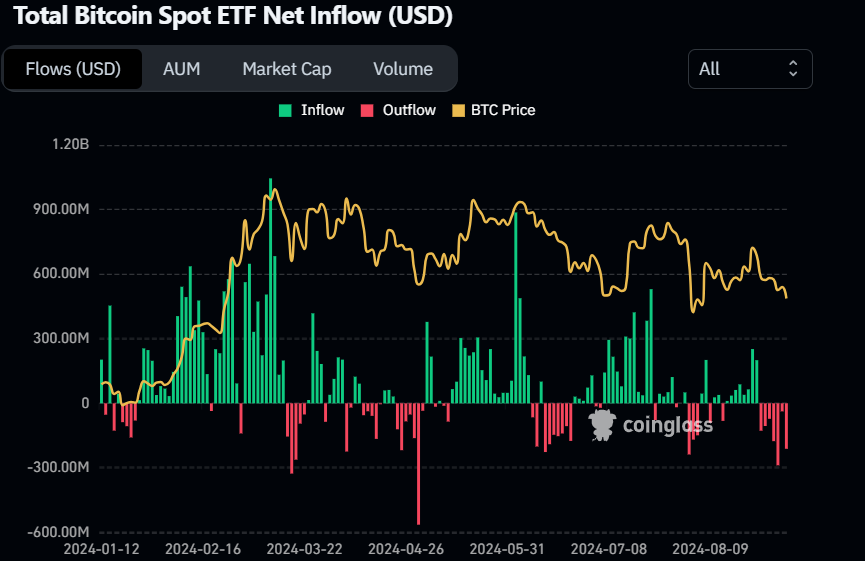
Bitcoin Spot ETF Net Inflow chart
Additionally, Lookonchain data shows that institutions might be selling their BTC holdings. Ceffu, an institutional custody, asset management, and off-exchange settlement solutions company, deposited 2,000 BTC from Monday to Wednesday and, in total, 3,063 BTC worth $182 million into the Binance exchange since August 26. This transfer to the crypto exchange could signal that Ceffu is ready to sell these holdings.
Furthermore, a whale deposited 1,000 BTC worth $55.63 million on the Binance exchange on Friday.
It seems that institutions are selling $BTC!#Ceffu has deposited 3,063 $BTC($182M) into #Binance since Aug 26.https://t.co/yObVfoTnB1 pic.twitter.com/oaZKEZh2WJ
— Lookonchain (@lookonchain) September 4, 2024
The whale deposited 1,000 $BTC($55.63M) to #Binance 30 mins ago, losing ~$2.97M!https://t.co/KdVmf14vF4 pic.twitter.com/xQLFmcgW4d
— Lookonchain (@lookonchain) September 6, 2024
Weak NFP provides support, but not enough
The US economy added 142,000 jobs in August, slightly less than the 160,000 expected. Bitcoin reacted positively to the news, rising by around 1.5% within the first 30 minutes after the publication of the data. Signs of a weakening labor market increase the chances that the US Federal Reserve (Fed) would opt for a rapid cut in interest rates in the upcoming September meeting, a scenario that generally favours risk assets such as cryptocurrencies because lower rates stimulate the economy.
Still, Bitcoin price failed to rebound significantly as investors took the numbers as weak but not alarming, raising doubts about what the next moves from the Fed will be.
On-chain data shows negative bias
CryptoQuant’s Bitcoin Coinbase Premium Index, a key indicator of how large-wallet investors behave, suggests decreasing interest from whales in the top crypto. The indicator shows the gap between the Coinbase Pro price (USD pair) and the Binance price (USDT pair). Coinbase Premium data is one of the indicators that shows a sign of whale accumulation, as the Coinbase Pro platform is considered the gateway for institutional investors to purchase cryptocurrencies.
In the case of Bitcoin, the index fell from 0.013 to -0.04 from Monday to Thursday, trading below its 14-day Simple Moving Average (SMA) at 0.010. This indicates that whales are continuously selling at a lower premium. In addition, it shows a decrease in investors' interest and activity in Coinbase.
-638612232676036347.png)
Bitcoin Coinbase Premium Index chart
Moreover, Coinglass’s Bitcoin’s long-to-short ratio is 0.93, at its lowest since August 28, meaning more traders anticipate the asset’s price to fall.
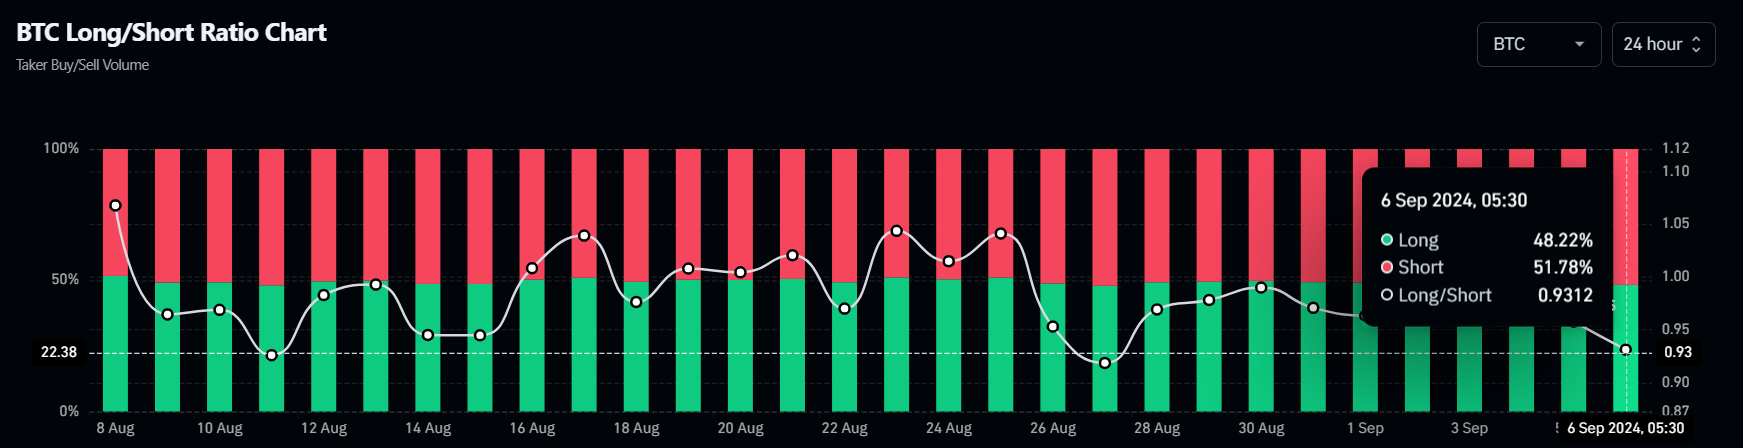
Bitcoin long-to-short ratio chart
Santiment’s Daily Active Addresses index also paints a bearish picture as it helps track network activity over time. A rise in the metric signals greater blockchain usage, while declining addresses point to lower demand for the network.
In BTC’s case, Daily Active Addresses fell from 836,960 on August 30 to 685,350 on Friday, constantly decreasing since mid-March. This indicates that demand for BTC’s blockchain usage is decreasing, which could propel a decline in Bitcoin price.
%20[15.27.23,%2006%20Sep,%202024]-638612233314039685.png)
Bitcoin Daily Active Addresses chart
Is BTC out of the woods?
Bitcoin was rejected after retesting its 50% price retracement level at $59,560 (drawn from a high in late July to a low in early August) on Monday and dropped 5% the next three days. As of Friday, it continues to trade slightly down at around $56,000.
If BTC closes below the $56,022 daily support level, it could decline by 3.5% to retest the psychological level of $54,000.
The Relative Strength Index (RSI) and the Awesome Oscillator (AO) momentum indicators on the daily chart trade below their respective neutral levels of 50 and zero, respectively. Both indicators suggest weak momentum and a continuation of the downward trend.
If the bears are aggressive, the overall crypto market is negative, and BTC closes below $54,000, it could extend an additional decline of 7.5% to retest its daily support at $49,917.
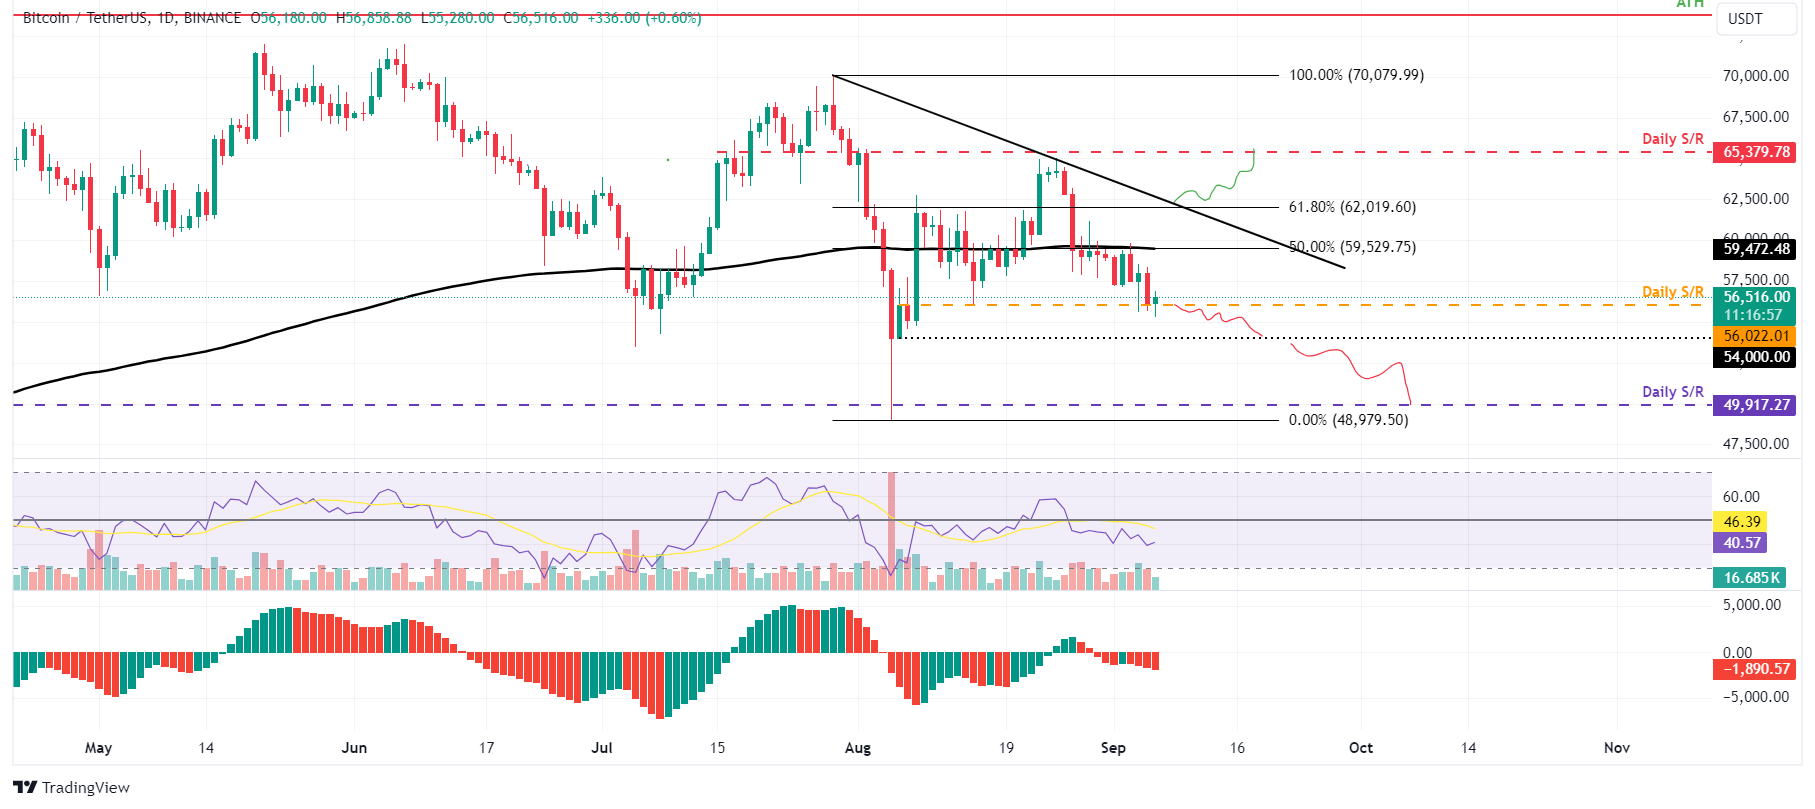
BTC/USDT daily chart
However, if Bitcoin’s price breaks above the $59,560 resistance and closes above $62,019, the 61.8% Fibonacci retracement level, the bearish thesis will be invalidated. In this scenario, BTC could extend the positive move by 5.5% to revisit its daily resistance level at $65,379.
Author

Manish Chhetri
FXStreet
Manish Chhetri is a crypto specialist with over four years of experience in the cryptocurrency industry.


