Bitcoin price: The slingshot is pulled back, BTC ready to test $16,900?
- Bitcoin price chart reveals no strong trend and this can mean further testing to the downside, starting at $16,900.
- On-chain analysts believe the catalyst for Bitcoin price trend reversal is the trend of USD and equities.
- Analysts believe Bitcoin price is in the buy zone and recommend accumulating BTC at the current price level below $20,000.

Bitcoin price trend offer mixed signals as to the direction in which BTC is headed. On-chain analysts at Jarvis Labs believe Bitcoin’s next move relies on the performance of US equities. Bitcoin price could plummet and hit the downside target of $16,900 in the short-term.
Also read: JUST IN: Crypto giant Coinbase licensed to operate in Singapore, major move for COIN
Why Bitcoin price trend remains undecided
Bitcoin remained in its holding pattern as investors remain vigilant for updates on inflation. Bitcoin price struggled to sustain above the $19,000 level and yielded 6.2% losses for holders over the past week. Over the past month, BTC price ranged between the $19,000 and $21,000 level.
Traders remain cautious ahead of Wednesday’s release from the Federal Open Market Committee (FOMC), the monetary policy making body of the US Federal Reserve. The release could influence traders’ sentiment towards risk assets like Bitcoins and altcoins.
Analysts at the crypto research firm Jarvis Labs rifled through Bitcoin accumulation, BTC whale holdings, divergence charts and price trends broken down by timezones, to no avail. Analysts identified no significant trend in Bitcoin’s price.
Analysts evaluated the Bitcoin supply shock ratio, a measure of coins that are not moving on the network. Will Clemente, a leading crypto analyst shared the following chart:
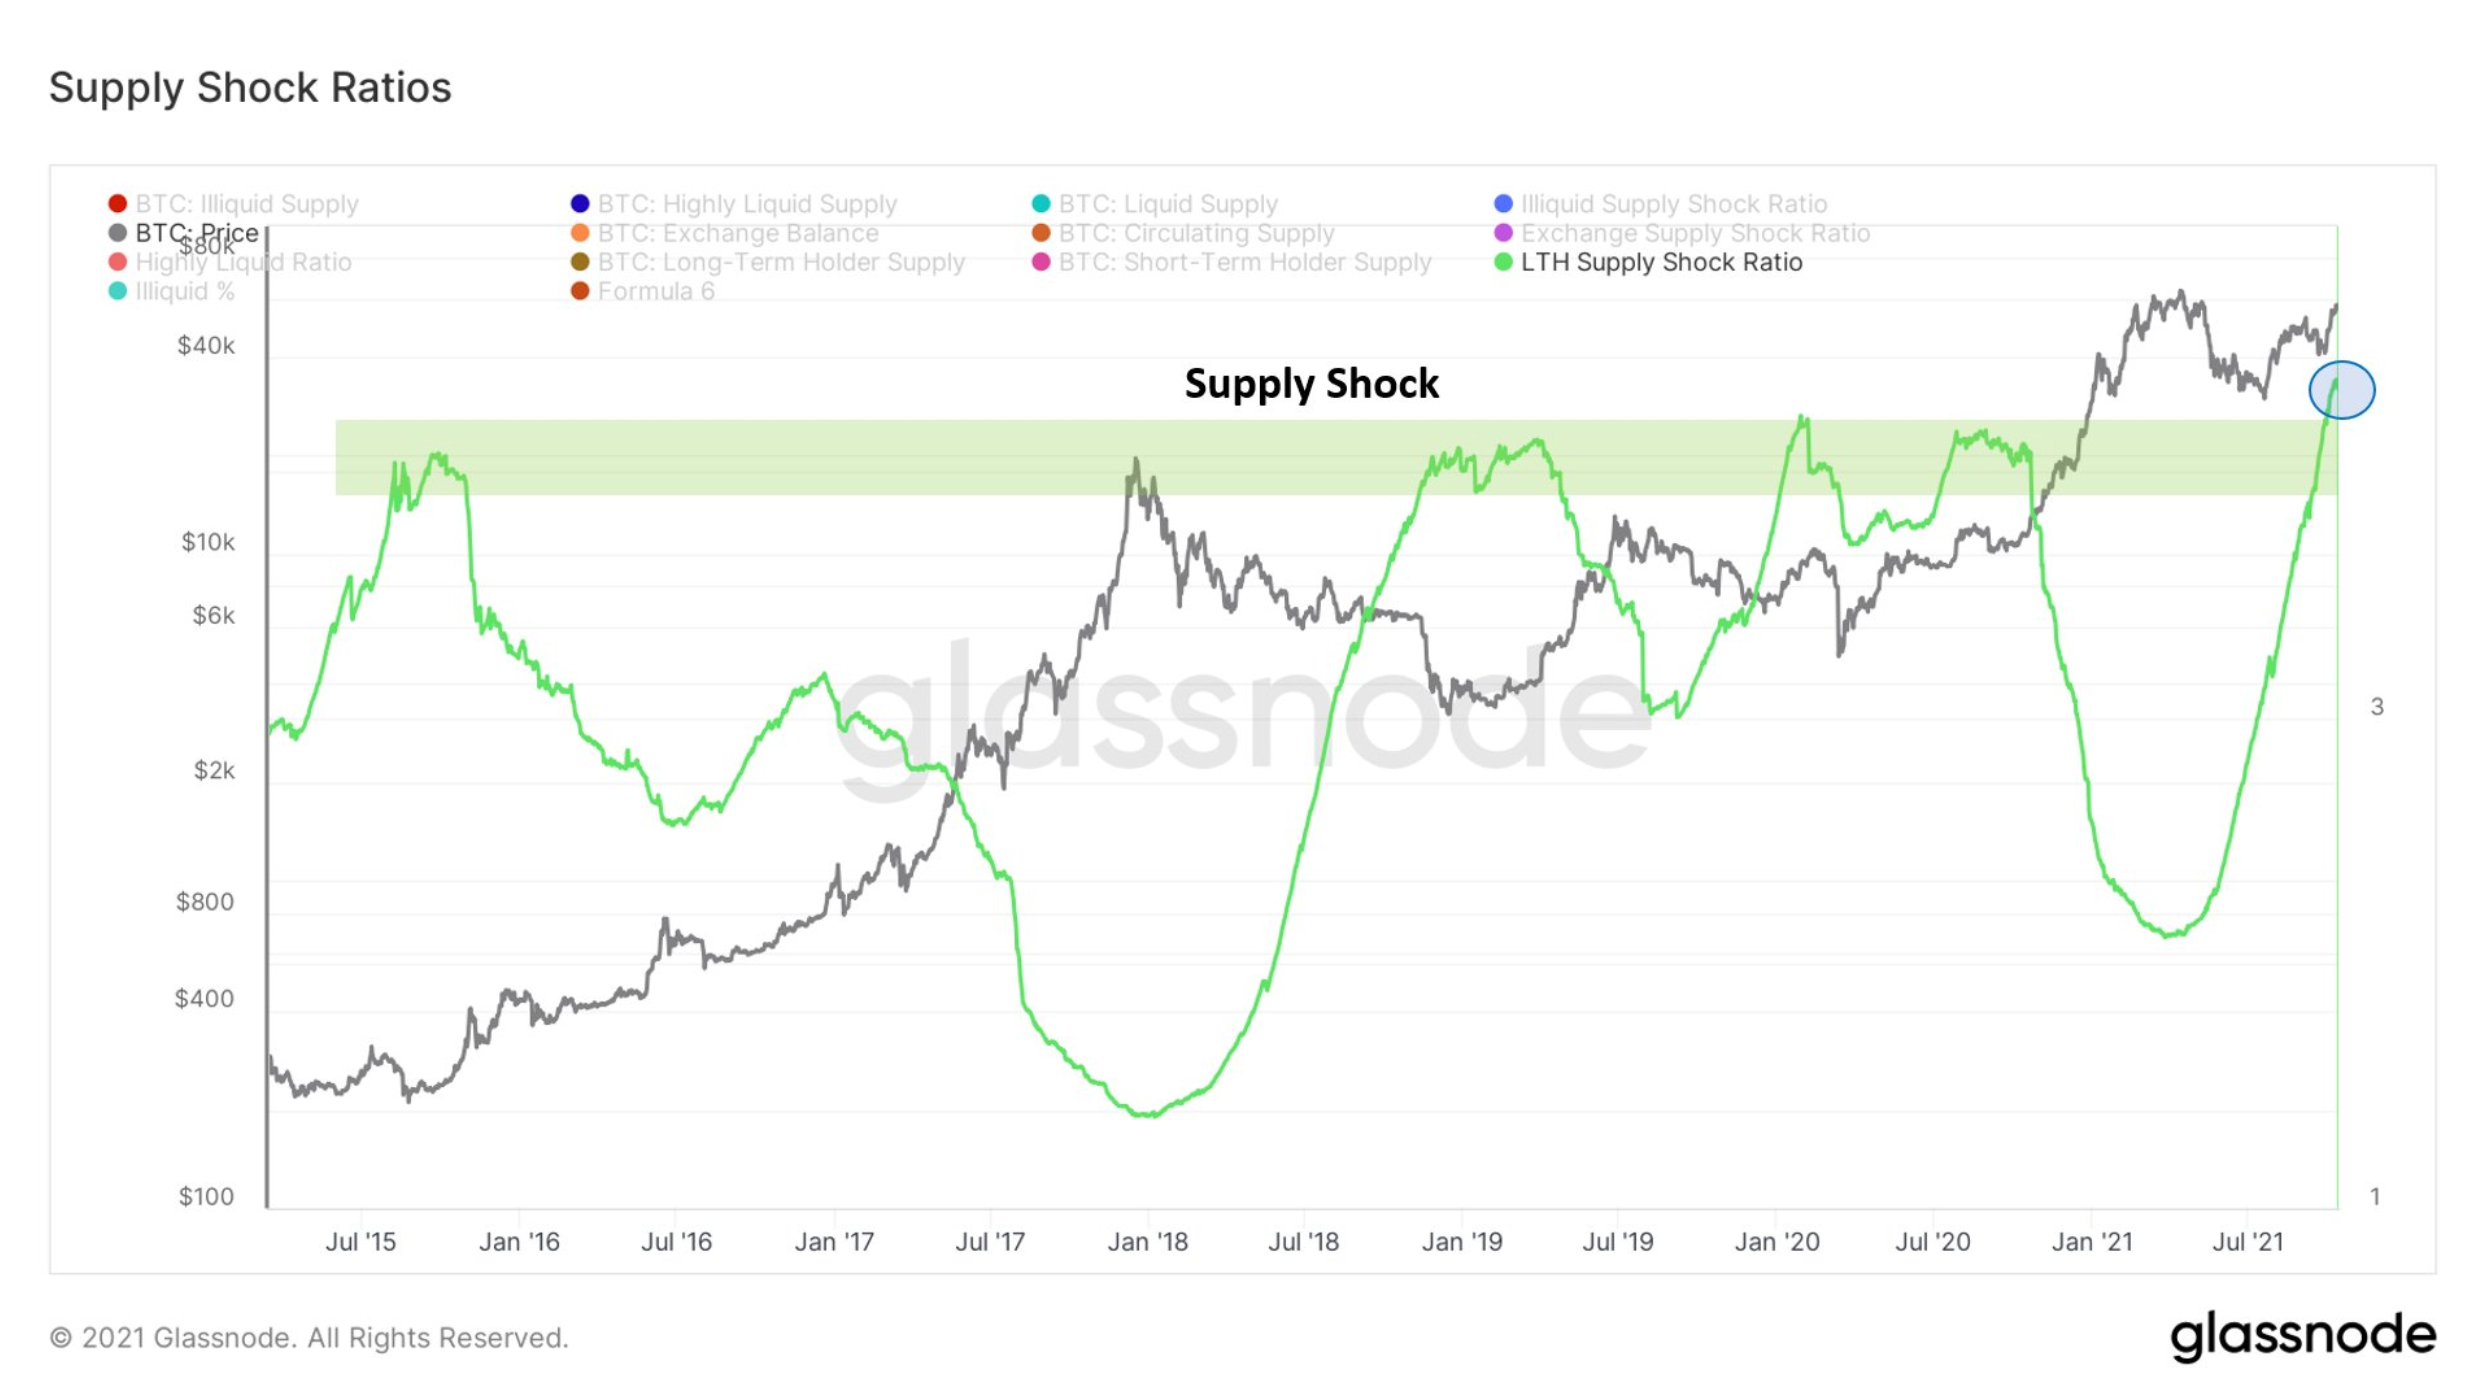
Bitcoin Supply Shock Ratio
Analysts tend to categorize Bitcoin as illiquid based on the current Supply Shock Ratio level. The behavior of large wallet investors indicates reservations in transacting in Bitcoin. The higher the reading, the higher the strength of the Bitcoin price rally. Once the measure moves sideways for a period of time, there is a massive rally in BTC. The exception to the phenomenon is the March 2020 crash in Bitcoin.
The fact that a large portion of Bitcoin supply is acting in a similar manner as previous instances, paired up high open interest in Bitcoin futures makes analysts consider this a rubber band setup.
Bitcoin price at risk of plunge to $16,900
Analysts at Jarvis Labs remain undecided on the Bitcoin price trend based on the chart. However, they consider this indicative of further testing to the downside. Liquidity for Bitcoin sites is around $18,000 and much larger pools start at the $16,900 level. Bitcoin price drop to the $16,900 level is more likely.
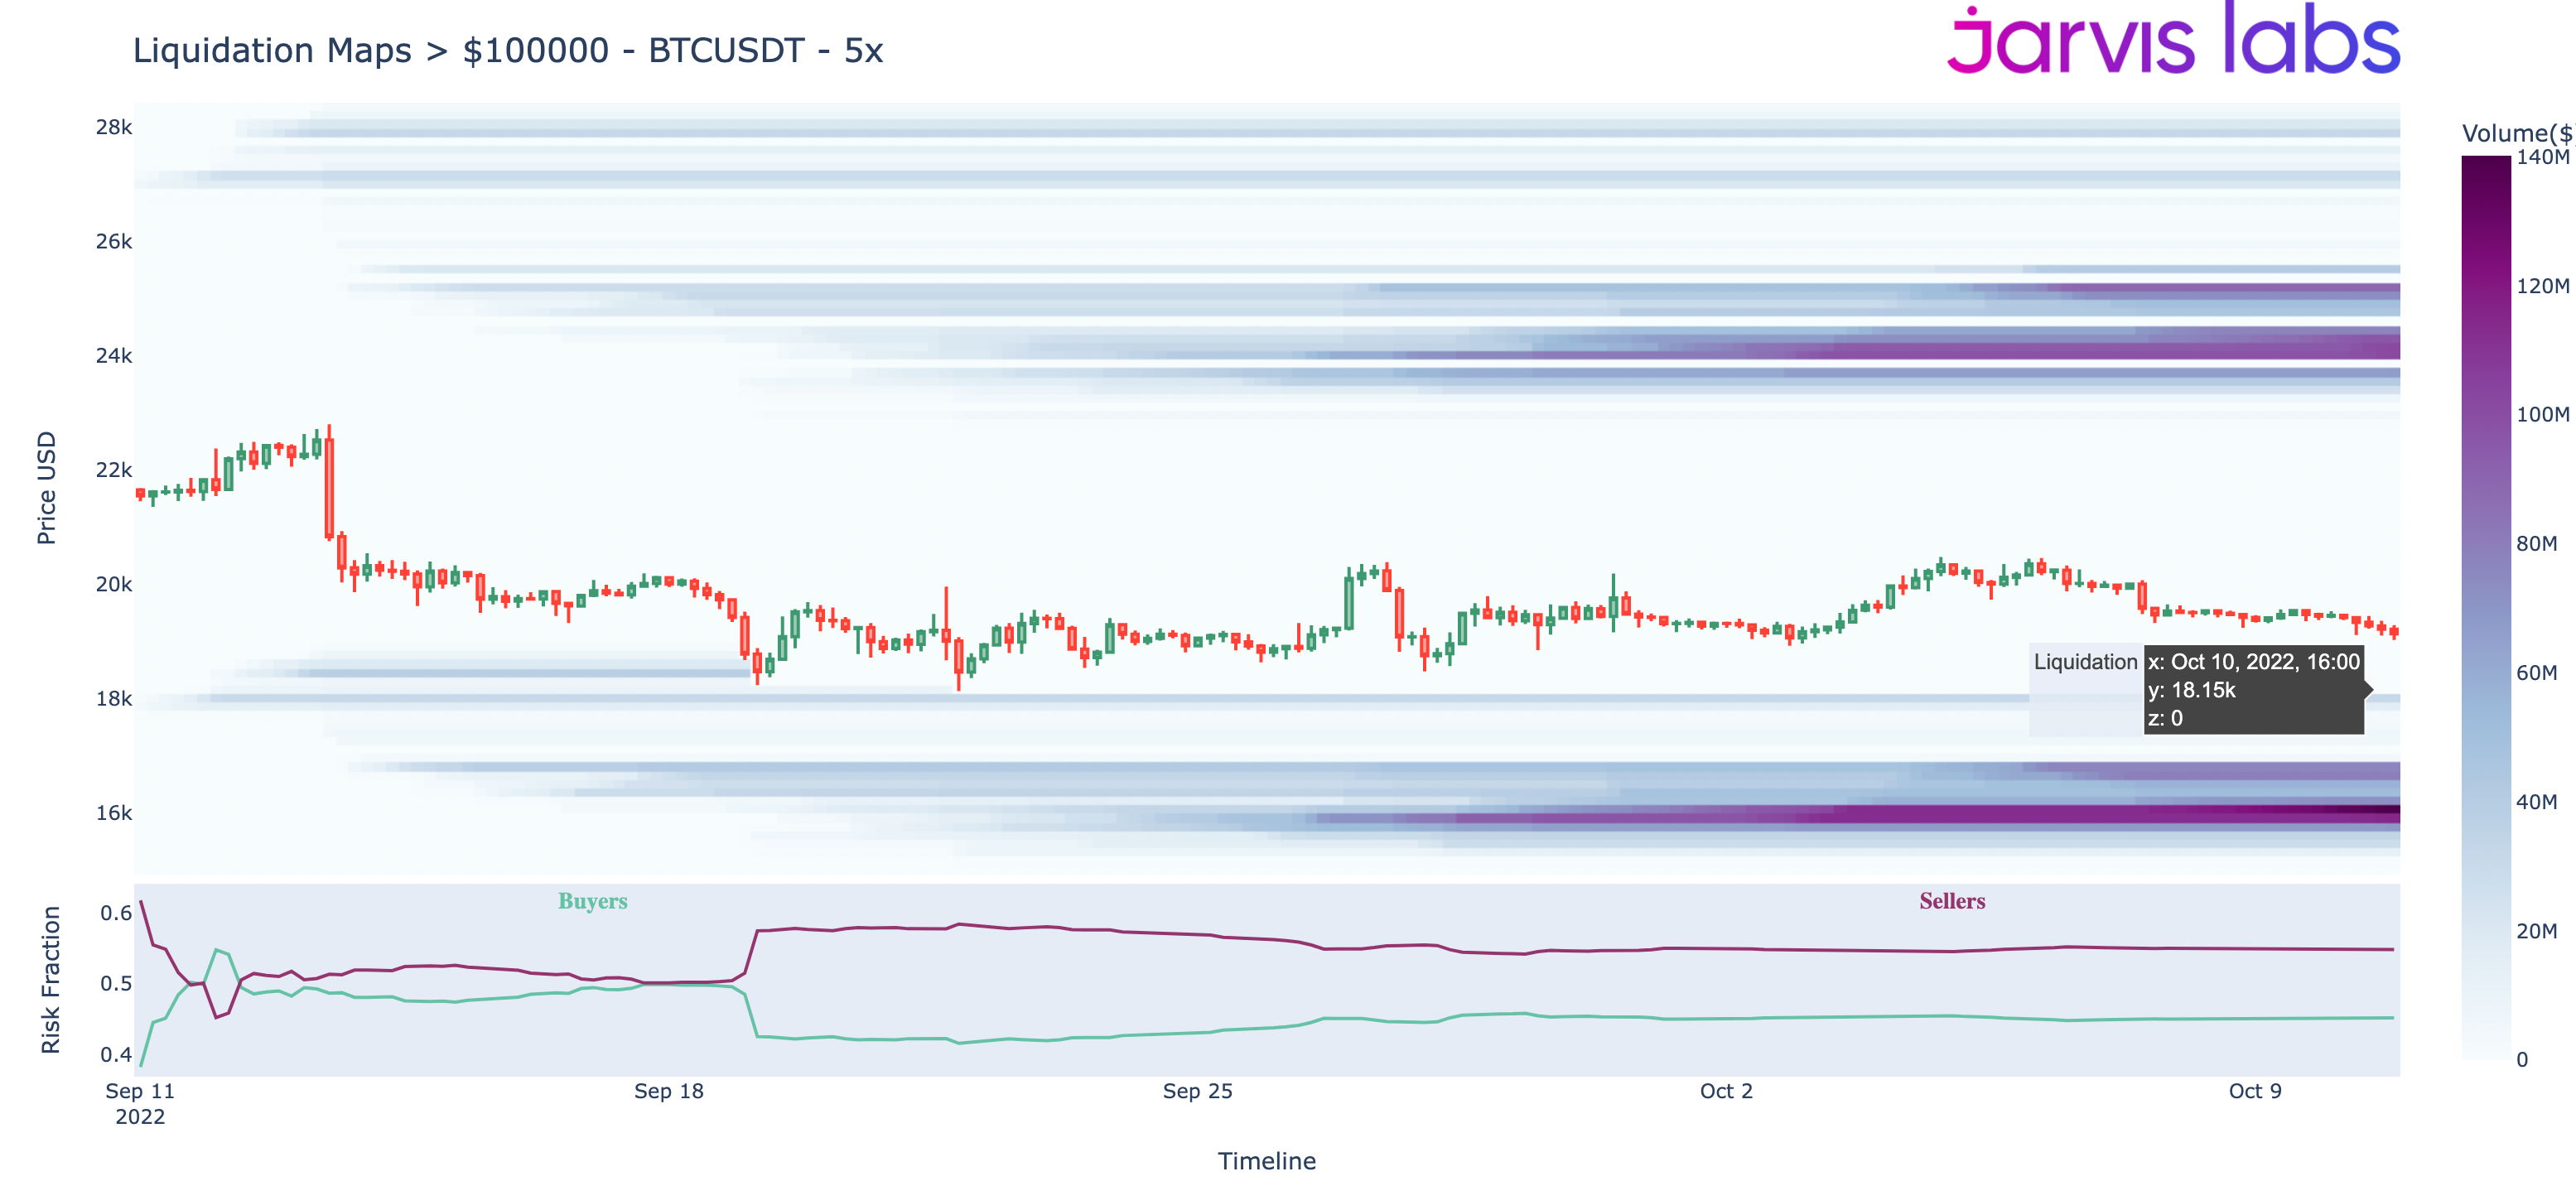
Bitcoin Liquidity Maps
Analysts consider BTC is ready for accumulation
ElCryptoProf, a pseudonymous crypto analyst believes Bitcoin price is ready for accumulation at the current price level, above $19,000. The analyst used the buy/sell indicator used to mark every bottom and top in Bitcoin’s price history.
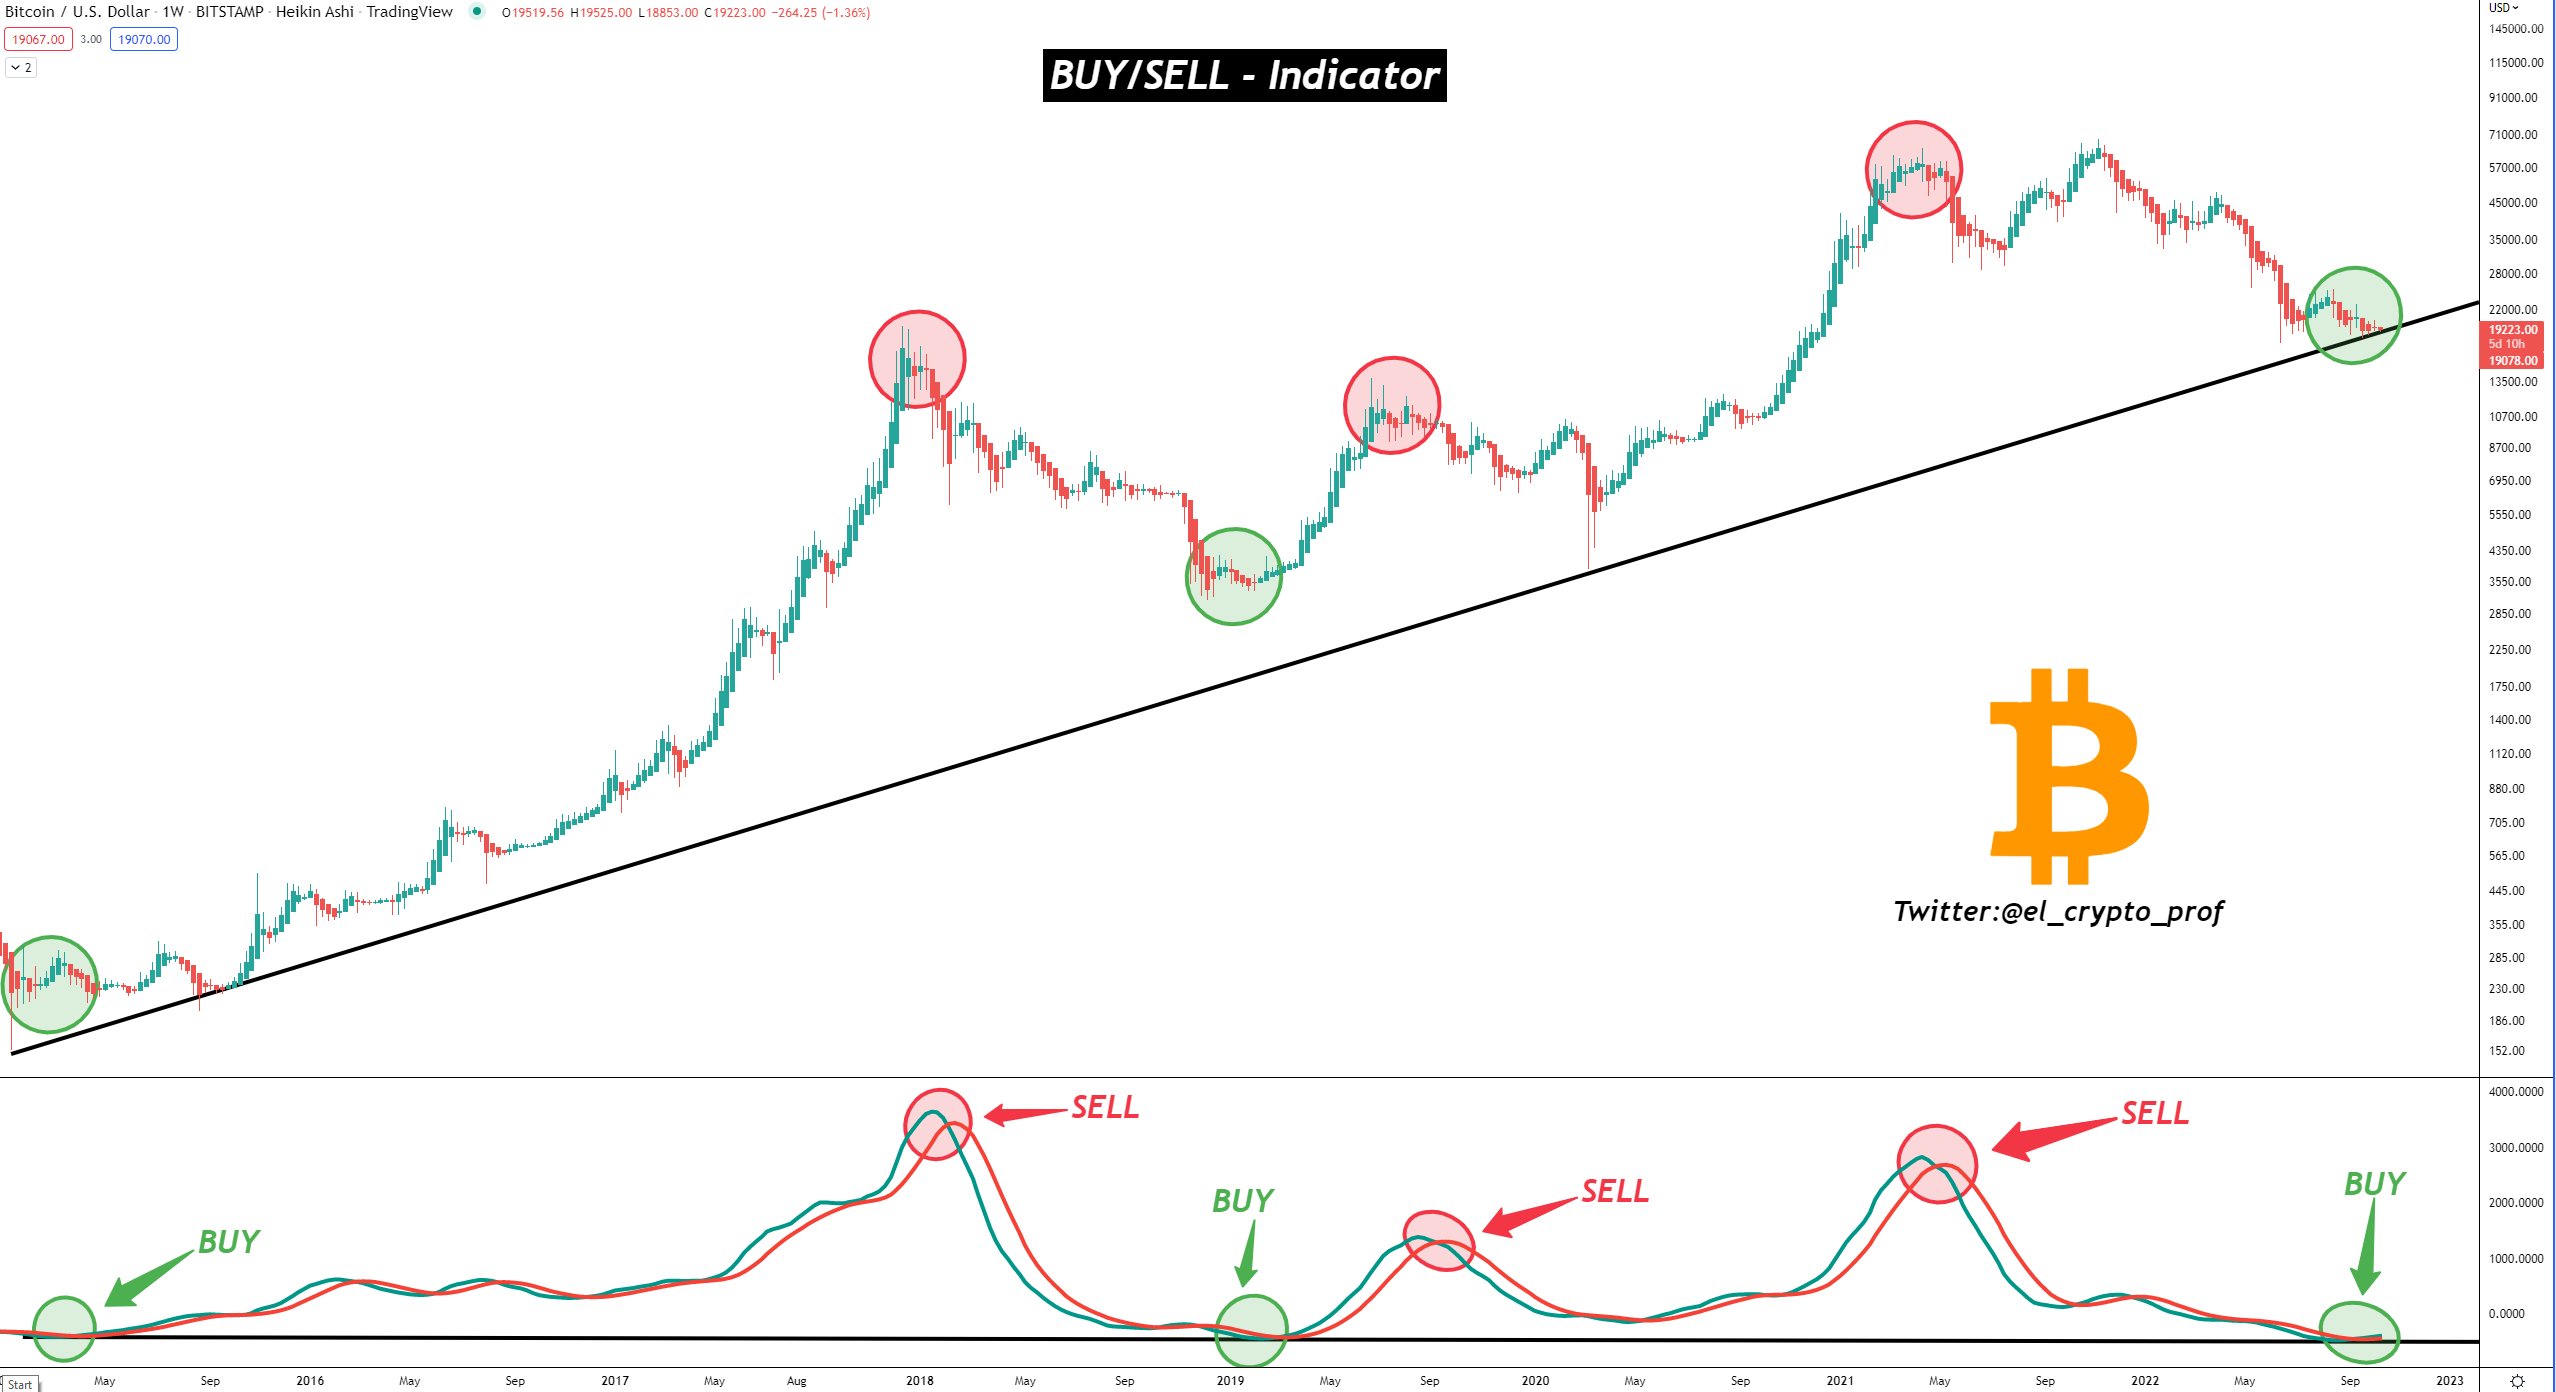
Bitcoin Buy/Sell indicator
Author

Ekta Mourya
FXStreet
Ekta Mourya has extensive experience in fundamental and on-chain analysis, particularly focused on impact of macroeconomics and central bank policies on cryptocurrencies.