Bitcoin price holds up above $60,000, propelled by expectations of Fed rate cuts
- The US Federal Reserve's Minutes of the July meeting hint at a rate cut in September, supporting Bitcoin price.
- US spot Bitcoin ETFs saw a modest inflow of $39.50 million on Wednesday, marking the third consecutive day of gains this week.
- On-chain data paints a bearish picture, with Bitcoin OTC desk balances for miners surging and the long-to-short ratio below one.

Bitcoin (BTC) trades above $61,000 on Thursday, holding up on gains driven by the release of the Fed Minutes on Wednesday, which hinted at an interest-rate cut in September. US spot Bitcoin ETFs saw a modest inflow on Wednesday, while on-chain data doesn’t seem to support further price gains as Bitcoin OTC desk balances for miners surge and the long-to-short ratio stays below one.
Daily digest market movers: Fed Minutes support Bitcoin
- On Wednesday, The Federal Open Market Committee (FOMC) Minutes showed that most participants said that "it would likely be appropriate to ease policy at the next meeting if data continued to come in as expected." Furthermore, the minutes added that, for some policymakers, the recent progress on inflation and the increase in the unemployment rate warranted a 25-basis point (bps) already a rate cut at the July meeting. The prospect of lower interest rates tends to favor risk assets, including cryptocurrencies.
- Coinglass data shows that US spot Bitcoin ETFs saw a modest inflow of $39.50 million on Wednesday, marking the third consecutive day of gains this week. While these small net flows can indicate investor sentiment, they are relatively minor compared to the $54.16 billion in total Bitcoin reserves held by the 11 US spot Bitcoin ETFs. Still, the ETFs have registered five consecutive days of inflows, the longest streak since the beginning of July.
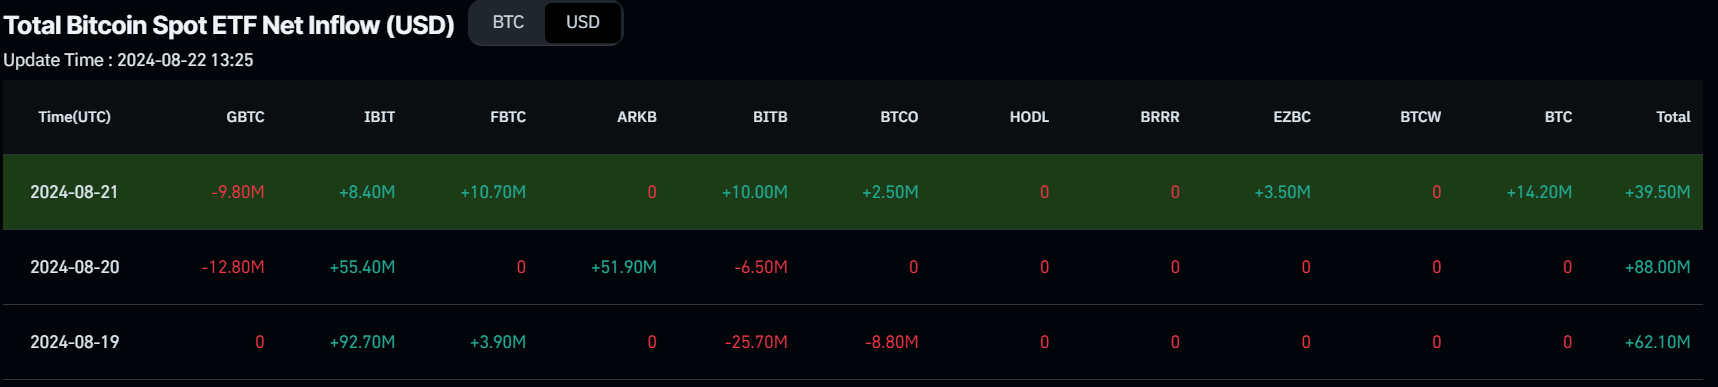
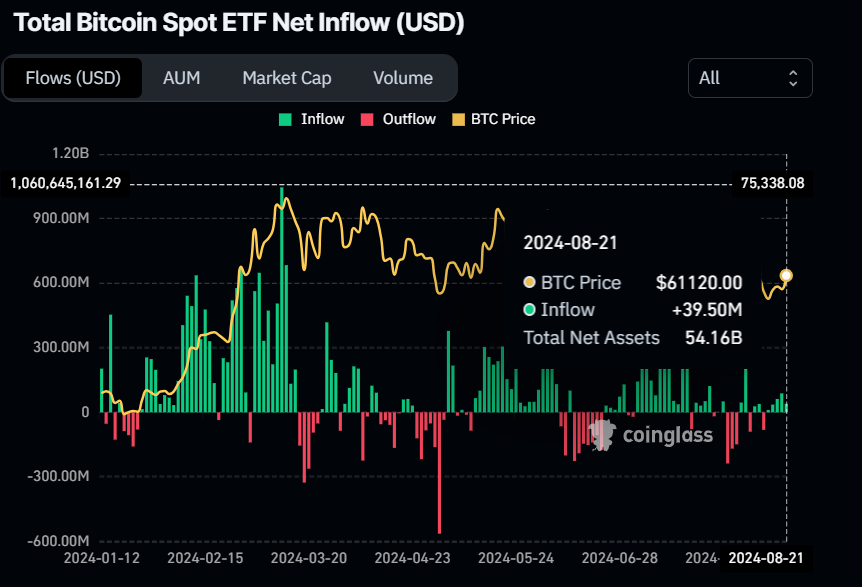
Bitcoin Spot ETF Net Inflow chart
- CryptoQuant data shows that Bitcoin OTC desk balances for miners have surged by more than 70% over the last three months, increasing from 215,000 BTC in June to 368,000 BTC in August, a level not seen since June 2022. This sharp rise hints that miners ramp up their selling activity, using OTC (Over-The-Counter)—deals to handle large trades discreetly without shaking up market prices.
- Typically, when OTC balances for miners go up, Bitcoin prices tend to drop, as shown in the graph below. This trend might be a sign of potential downward pressure on the market.
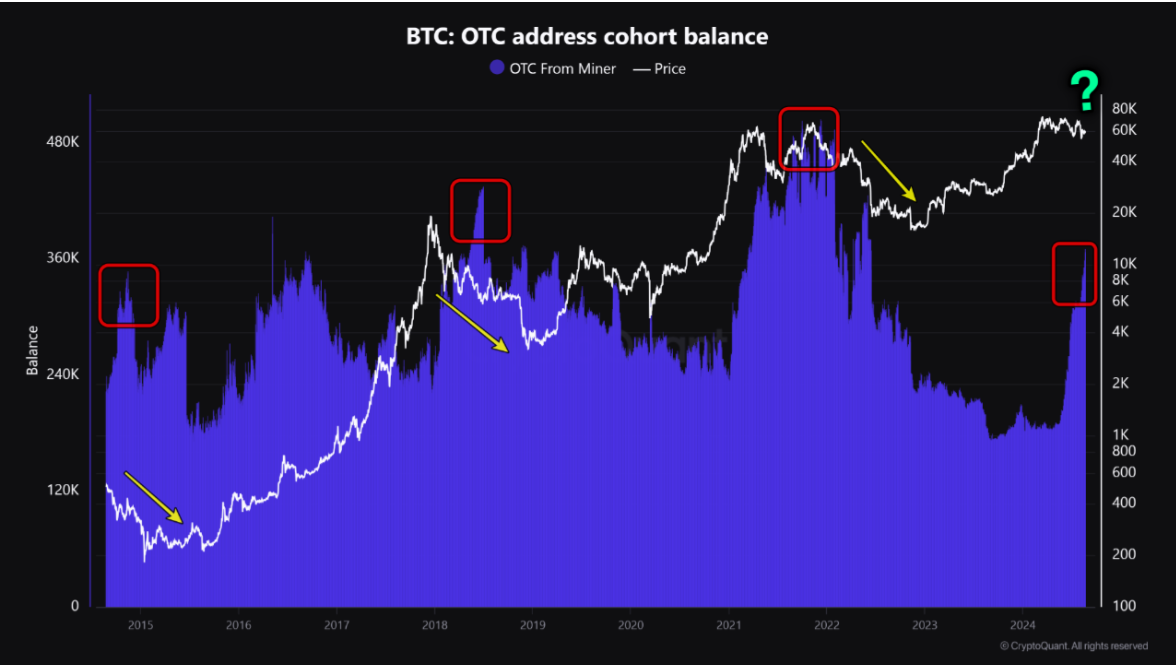
BTC OTC desk balances for miners chart
- Additionally, according to Coinglass's data, BTC's long-to-short ratio is at 0.938. This ratio suggests bearish sentiment in the market, as a number below one signals that more traders anticipate the price of the asset to decline.
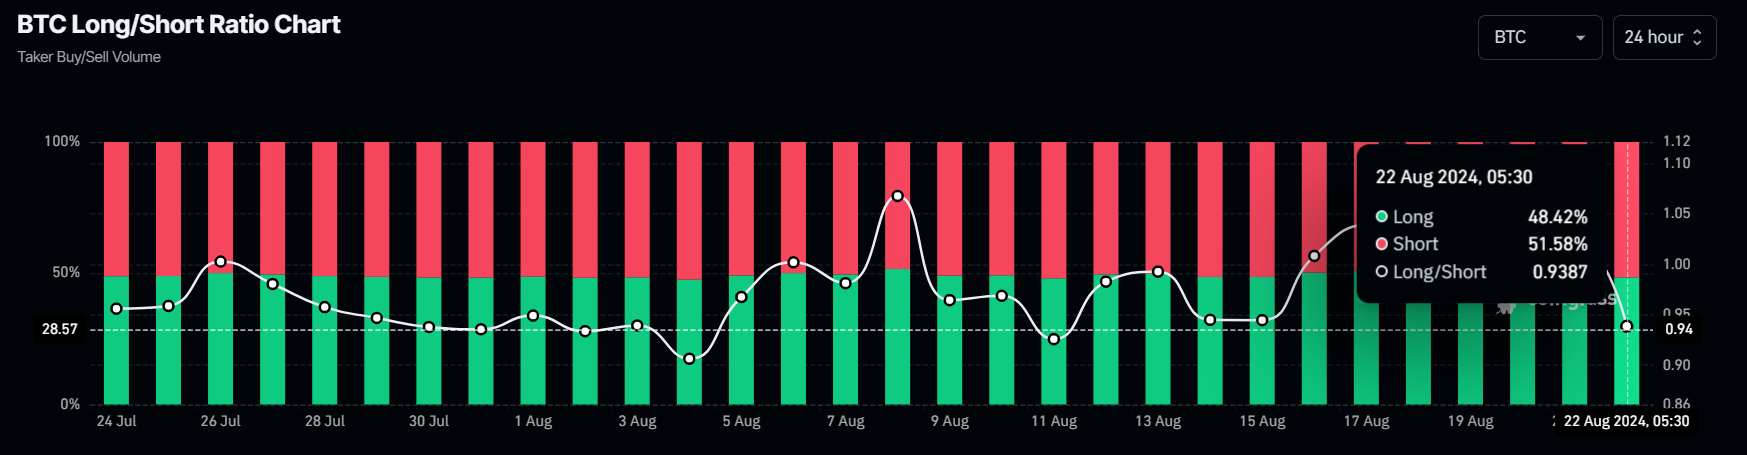
BTC long-to-short ratio chart
Technical analysis: BTC poised for decline as it nears $62,000
Bitcoin's price rose 3.7% on Wednesday after the Fed Minutes were released. As of Thursday, it trades slightly higher by 0.3% at $61,298 and approaches a key resistance level at $62,066.
If BTC continues to rise, it may find resistance around the $62,066 level, which is the 61.8% Fibonacci retracement drawn from the high on July 29 to the low on August 5. This level aligns as well with the previously breached trendline and the 100-day Exponential Moving Average of around $62,135, making it a key resistance zone.
If BTC fails to close above the $62,066 level, it could drop to $57,115 before potentially declining by 19% to revisit the $49,917 daily support level.
The Relative Strength Index (RSI) on the daily chart has flipped over its neutral level of 50, and the Awesome Oscillator (AO) still trades below its neutral level of zero. Both indicators must trade below their neutral levels for bearish momentum to be sustained.
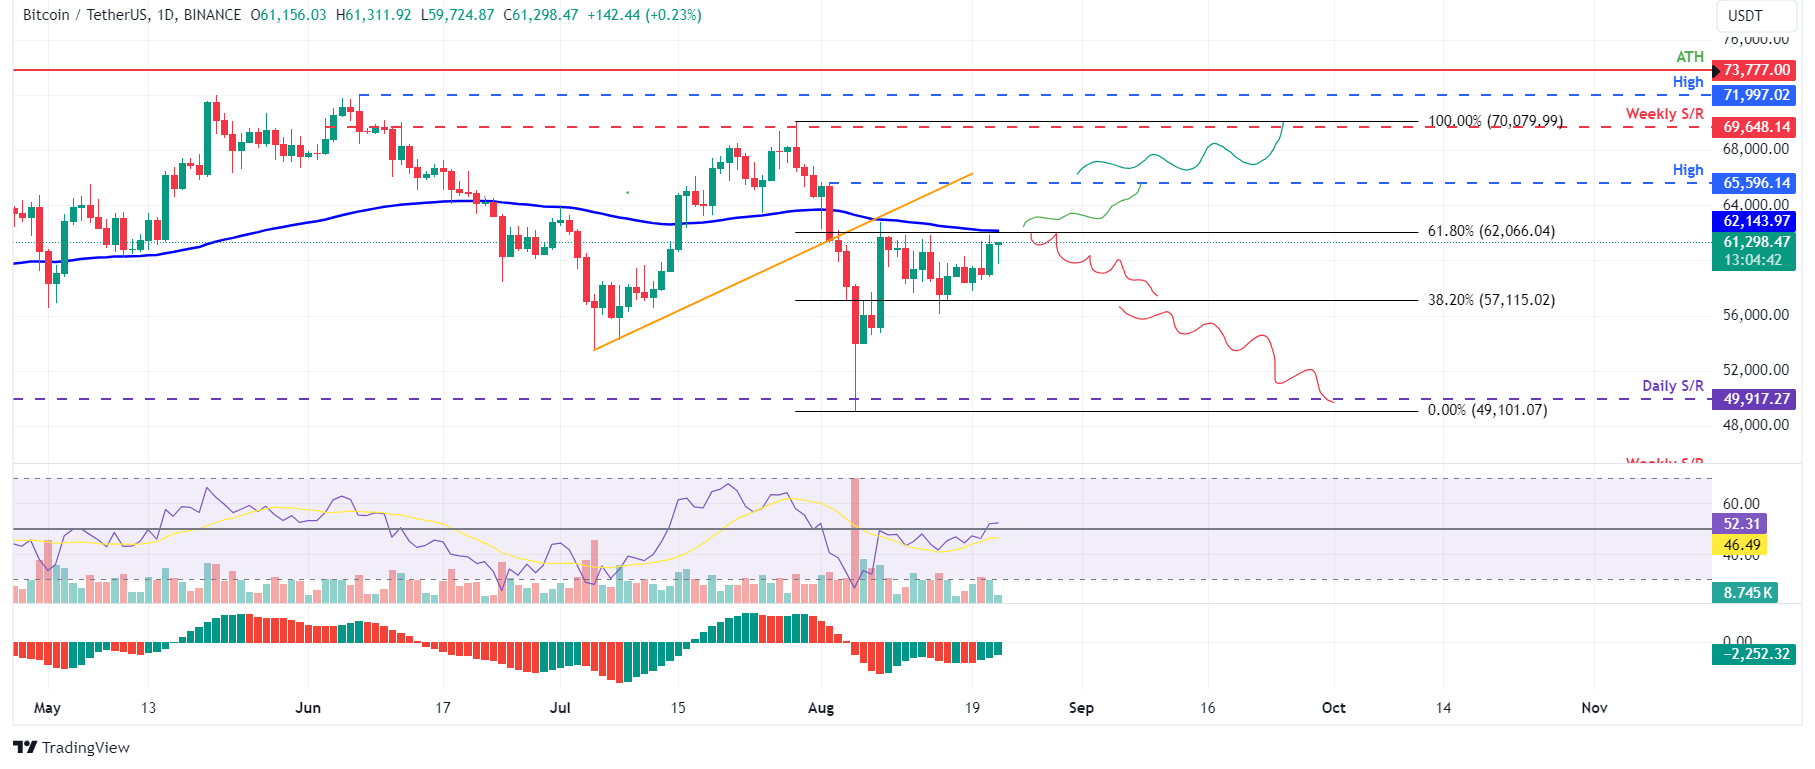
BTC/USDT daily chart
On the other hand, if Bitcoin's price can close above $62,066, a rise towards the August 2 high of $65,596 would be on the cards as it would set a higher high on the daily chart. This could lead to a further 6% price increase to test the weekly resistance at $69,648.
Bitcoin, altcoins, stablecoins FAQs
Bitcoin is the largest cryptocurrency by market capitalization, a virtual currency designed to serve as money. This form of payment cannot be controlled by any one person, group, or entity, which eliminates the need for third-party participation during financial transactions.
Altcoins are any cryptocurrency apart from Bitcoin, but some also regard Ethereum as a non-altcoin because it is from these two cryptocurrencies that forking happens. If this is true, then Litecoin is the first altcoin, forked from the Bitcoin protocol and, therefore, an “improved” version of it.
Stablecoins are cryptocurrencies designed to have a stable price, with their value backed by a reserve of the asset it represents. To achieve this, the value of any one stablecoin is pegged to a commodity or financial instrument, such as the US Dollar (USD), with its supply regulated by an algorithm or demand. The main goal of stablecoins is to provide an on/off-ramp for investors willing to trade and invest in cryptocurrencies. Stablecoins also allow investors to store value since cryptocurrencies, in general, are subject to volatility.
Bitcoin dominance is the ratio of Bitcoin's market capitalization to the total market capitalization of all cryptocurrencies combined. It provides a clear picture of Bitcoin’s interest among investors. A high BTC dominance typically happens before and during a bull run, in which investors resort to investing in relatively stable and high market capitalization cryptocurrency like Bitcoin. A drop in BTC dominance usually means that investors are moving their capital and/or profits to altcoins in a quest for higher returns, which usually triggers an explosion of altcoin rallies.
Author

Manish Chhetri
FXStreet
Manish Chhetri is a crypto specialist with over four years of experience in the cryptocurrency industry.


