Bitcoin price losing bullish momentum leaves namesake tokens BCH and BSV facing losses
- Bitcoin price has been hovering around the $27,500 mark for the last couple of days.
- Over the past week, Bitcoin Cash and Bitcoin SV have accrued declines worth 11.6% and 16.13%, respectively.
- BTC is once again nearing the point of a bearish crossover that could result in significantly higher losses.

Bitcoin price breached through the Exponential Moving Averages (EMA) this past week to trade above $27,500. The cryptocurrency has since been moving sideways; however, the declining bullishness spells trouble not only for BTC but its hard fork tokens, Bitcoin Cash and Bitcoin SV, as well.
Bitcoin namesake tokens in the red
Bitcoin acts as a guide for the entire crypto market most of the time; however, it tends to have a slightly deeper impact on some tokens over others. These are the hard forks of Bitcoin, namely Bitcoin Cash (BCH) and Bitcoin SV (BSV). Even before the biggest cryptocurrency in the world prepares for a potential decline, its namesake altcoins have already dipped.
BSV emerged as one of the biggest losers this past week as Bitcoin SV price crashed by more than 16% to trade at $33. In doing so, the altcoin has reached the point of testing the key support level of 50-day EMA.
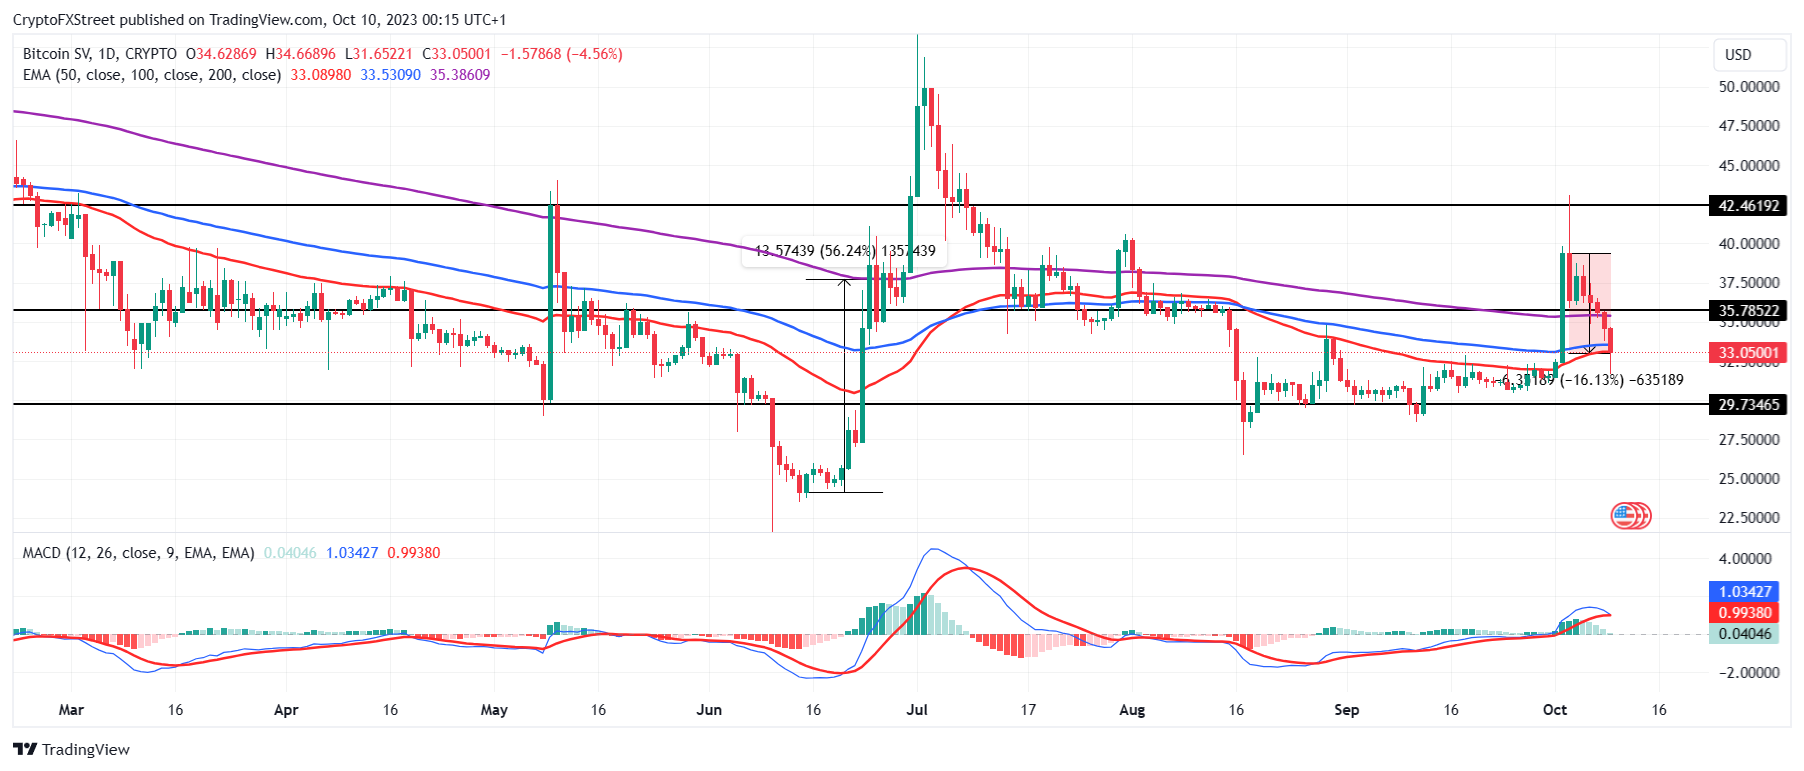
BSV/USD 1-day chart
Similarly, Bitcoin Cash price also declined by a little over 11%, resulting in the cryptocurrency changing hands at $217. Most of this decline came in the past 24 hours as BTC also fell by 1.24%. This is the effect of Bitcoin sharing a high correlation with BCH, which is presently at 0.88. This also spells good news for Bitcoin Cash as a recovery in BTC price would be favorable to the altcoin.
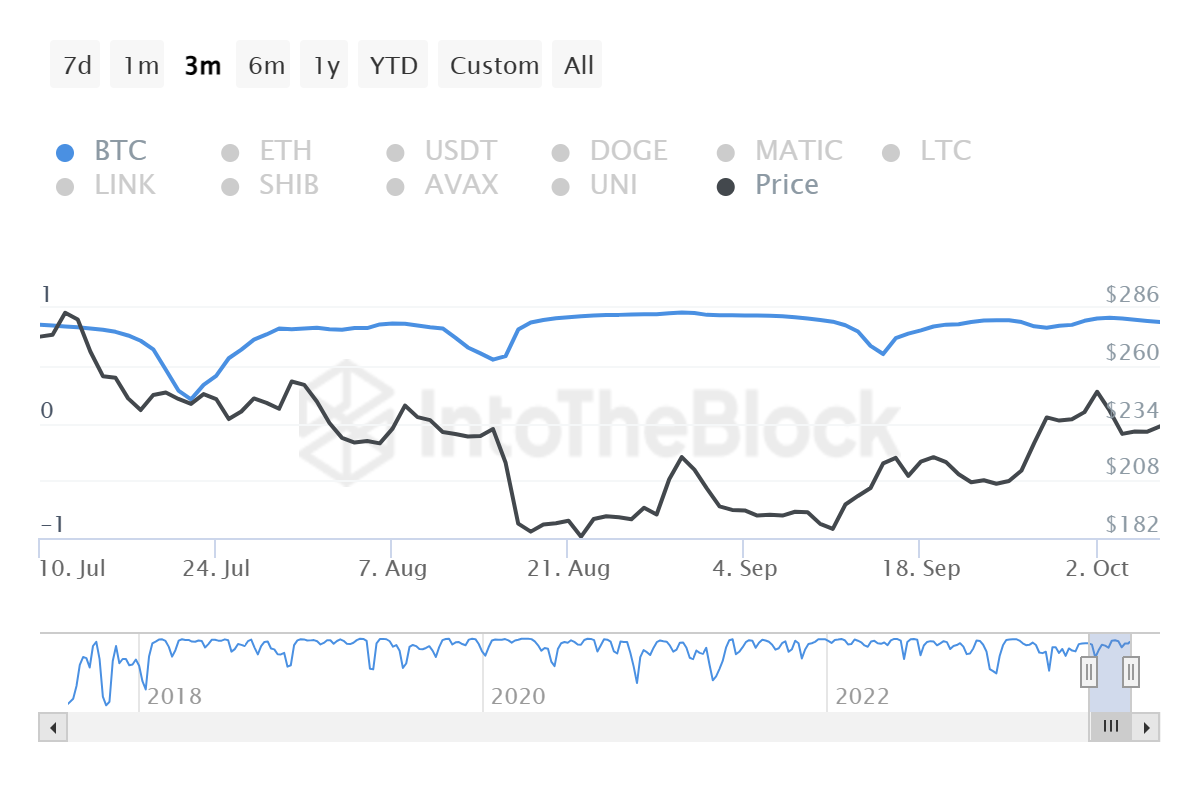
Bitcoin Cash correlation with Bitcoin
Bitcoin price recovery seems difficult
Bitcoin price is hovering around $27,500 at the time of writing, exhibiting chances of losing the support of the 100-day EMA as well as the support of $27,418. While the cryptocurrency would have the opportunity to bounce back from the confluence of the 50- and 200-day EMAs, the support at $26,430 would act as a safety net.
Losing this level would result in a crash below $25,000 for BTC. The Moving Average Convergence Divergence (MACD) indicator is exhibiting a declining bullish momentum visible on the bars on the histogram. At the same time, the MACD line (blue) is nearing the signal line (red), and slipping below it would establish a bearish crossover that could trigger losses for BTC.
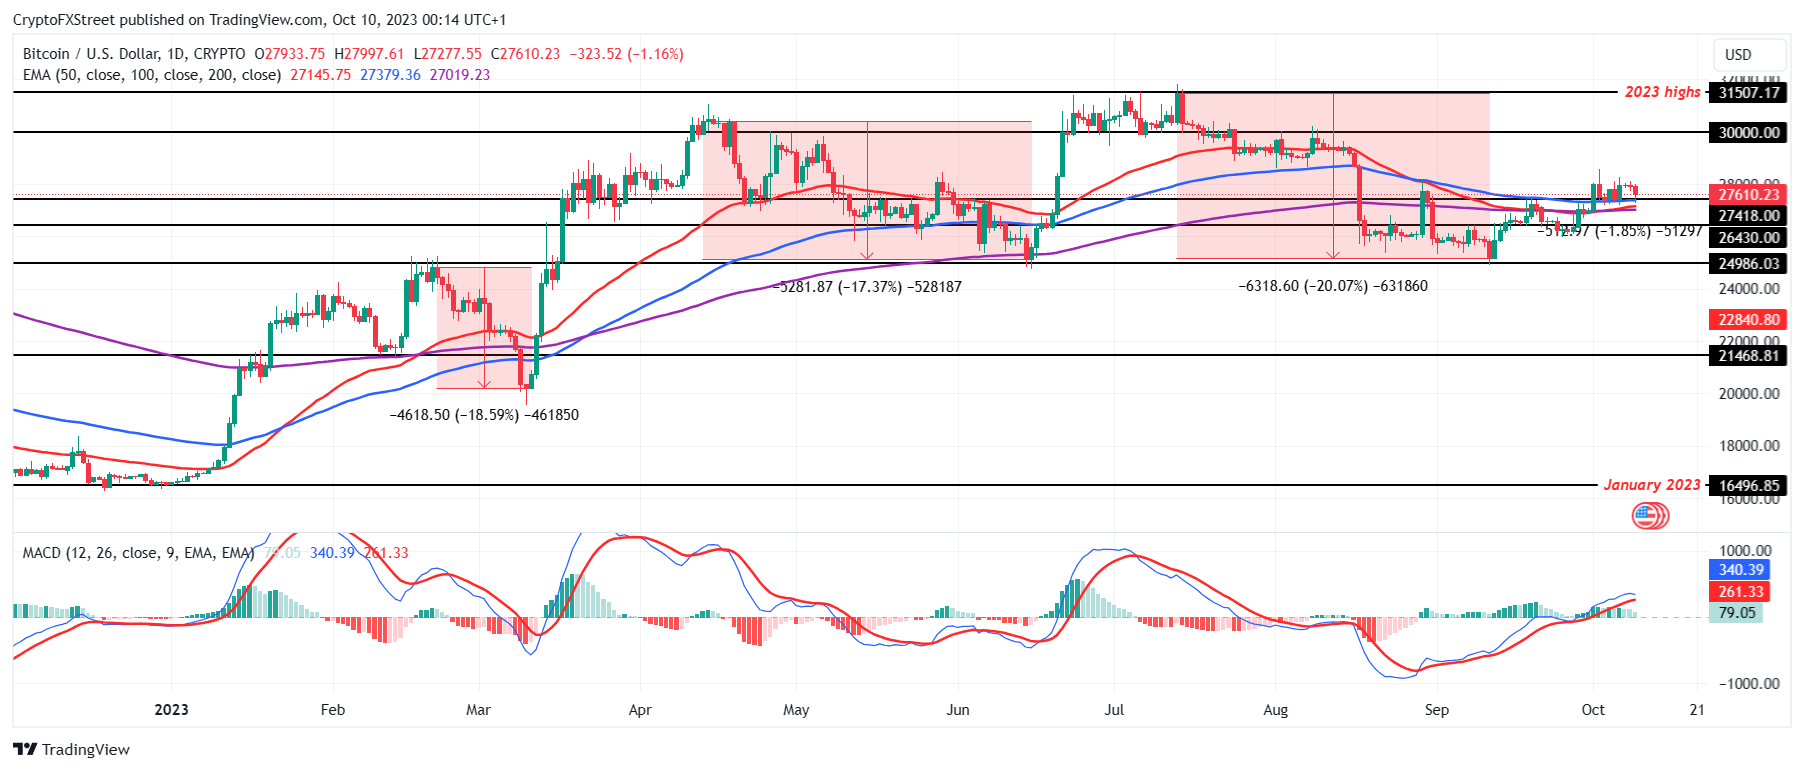
BTC/USD 1-day chart
But if Bitcoin price manages to sustain $27,418 as a support floor as it has for the past week, a breakdown is unlikely. Regardless, BTC would need support from its investors in order to pull back up toward $30,000.
Author

Aaryamann Shrivastava
FXStreet
Aaryamann Shrivastava is a Cryptocurrency journalist and market analyst with over 1,000 articles under his name. Graduated with an Honours in Journalism, he has been part of the crypto industry for more than a year now.


