Bitcoin price holds steady after FOMC minutes release, will BTC rally soon?
- Bitcoin price steadied and broke out of its triangle formation as US Federal Reserve officials agreed to slow the pace of interest rate hikes.
- FOMC minutes of the meeting show that US policymakers are focused on controlling the pace of price hike.
- Bitcoin price broke past the 50-day Exponential Moving Average at $16,714, despite a slew of liquidations at $16,575.

Bitcoin price held its ground above the 50-day Exponential Moving Average (EMA) at $16,714 and battled $760 million in liquidations at the $16,575 level. The largest asset by market capitalization is retesting crucial resistance at the beginning of 2023.
BTC has preserved its downward trend from the standpoint of realized price, an on chain metric that provides support and resistance points. Large wallet investors on the Bitcoin network have eased selling pressure on the asset, however, it is not substantial to trigger a rally in the asset just yet. BTC price recovery is therefore contingent on rising whale ownership of the cryptocurrency.
Find out more about Bitcoin’s price action before the release of FOMC minutes here.
Also read: Bitcoin price rally or short squeeze: $93.5 million in BTC shorts closed on Bitfinex
How Bitcoin price reacted to FOMC minutes release
Bitcoin price began the Asian trading session flat, BTC changed hands at $16,815 based on data from CoinGecko. The recently released minutes from the Federal Open Market Committee December meeting did not paint a clear picture of what the majority of traders were expecting. Fed members generally observed that a restrictive policy stance would need to be maintained until the incoming data provided confidence that core inflation was on a sustained downward path back down to 2%.
Several members commented that historical experience cautions against the premature loosening of monetary policy. The reaction among crypto traders was mixed, and investors await further clarity on the Fed’s stance as well as the size of the next interest rate increase.
Michaël van de Poppe, crypto analyst and trader said Bitcoin is poised to run up before the next FOMC meeting takes place on January 31 - February 1. The asset could witness a correction in its price post the meeting sothe run-up prior to the meeting, towards its next crucial resistance at $17,000, is crucial to keep BTC from collapsing.
Good old Powell with FOMC minutes moving the markets again.
— Michaël van de Poppe (@CryptoMichNL) January 4, 2023
Run up before the FOMC takes place, then correction after.
Run up on #Bitcoin towards crucial resistance, at $17K, which we marked earlier.
Probably more consolidation.
Looking for longs around $16.5-16.6K.
Where is Bitcoin price headed next?
Bitcoin price broke out of its triangle formation from the weekly chart. On the 4-hour chart BTC successfully crossed the 50-day EMA that acted as resistance in the last week of December. Climbing past the $16,714 level, BTC closed outside the upper trendline of the triangle formation and is testing resistance at the 200-day EMA at $16,904.
In the chart below, the release of FOMC minutes is marked with a bullish uptick in BTC, the asset retreated below the 200-day EMA soon after.
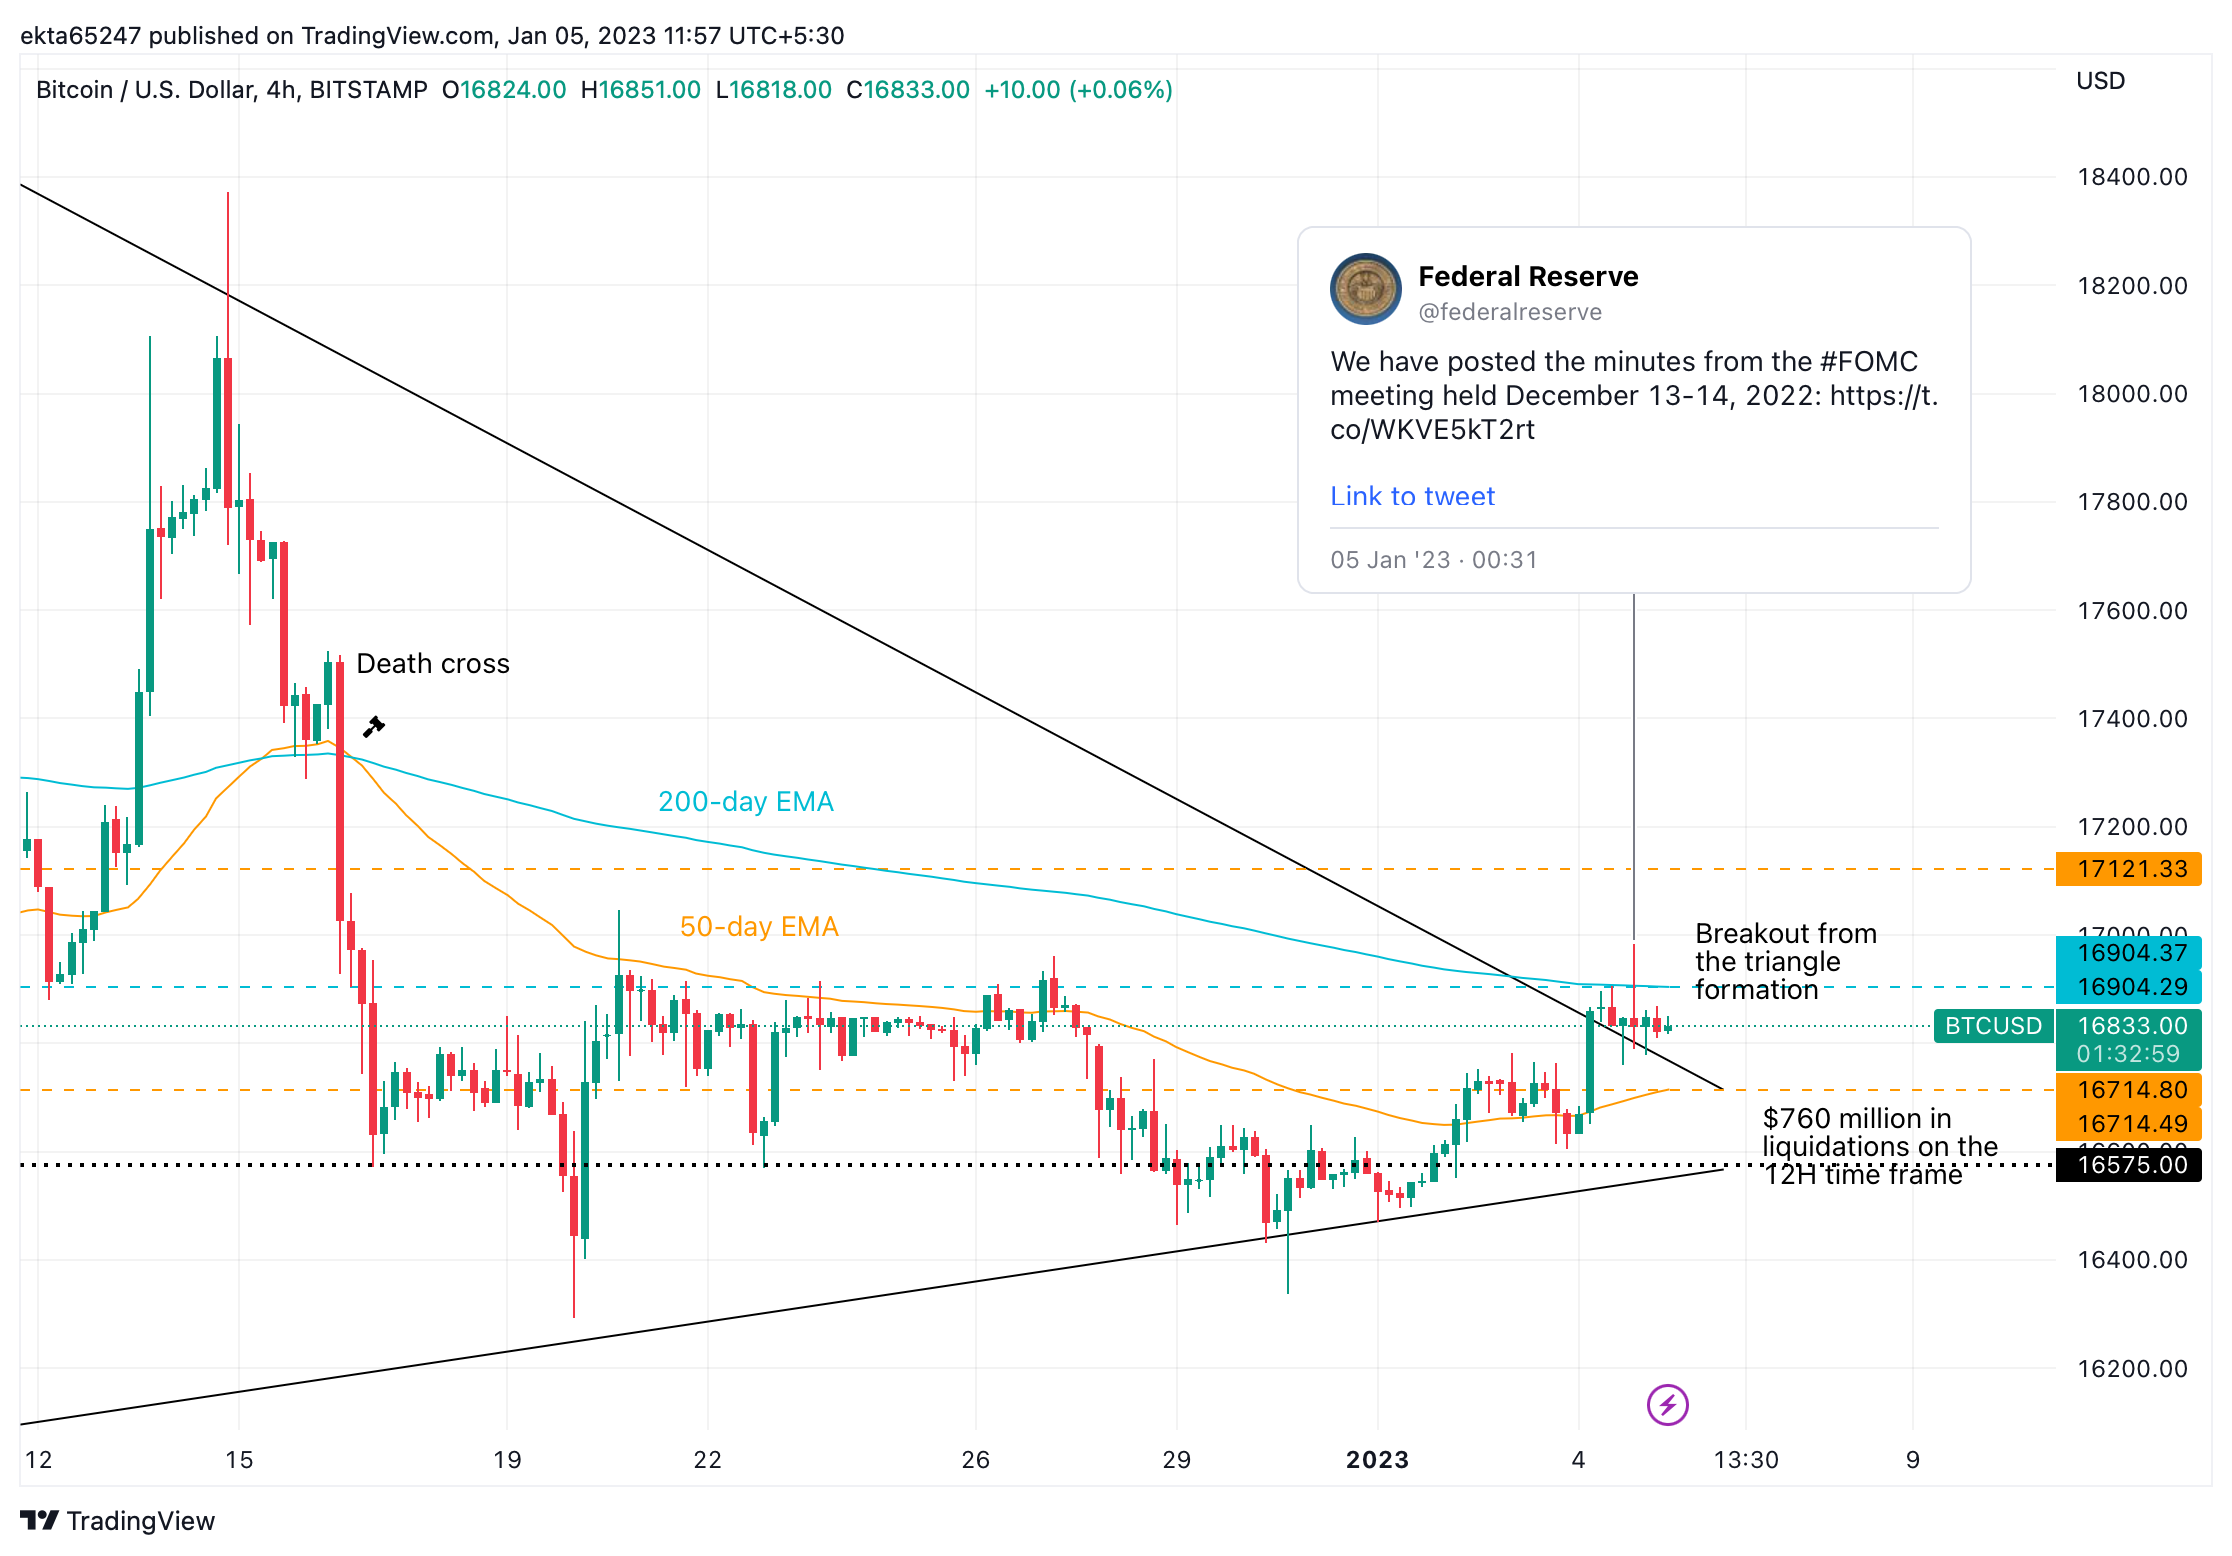
BTC/USD price chart
If the asset continues to climb higher, there are two key resistances, at the 200-day EMA and at the $17,121 level, the 50-day EMA on the weekly price chart. If BTC price fails to sustain above the 50-day EMA at $16,714, it could invalidate the bullish thesis and the asset could risk a fall to the $16,575 level where $760 million in liquidations were recorded by Coinglass.
The Relative Strength Index (RSI) on the 4-hour chart reads 60.44, away from the neutral region at 50 and climbing steadily towards overbought. Since RSI is below 70, BTC is not overbought yet and there is room for a rally in the asset.
What do on-chain indicators predict for Bitcoin price?
Bitcoin price is in a long-term downtrend on a multi-month timeframe and from the standpoint of realized price. Realized Price is an on-chain metric calculated as the realized market capitalization divided by the total coin supply. It can be interpreted as the on-chain support or resistance price.
BTC price is lower than the price that holders with 1,000 to 10,000 Bitcoins have realized. Since May 2022, the asset has struggled to break past resistance at $17,800 and this is considered as key resistance for BTC. The next resistance level is where holders with upwards of 10,000 BTC realized their holdings, $23,100.
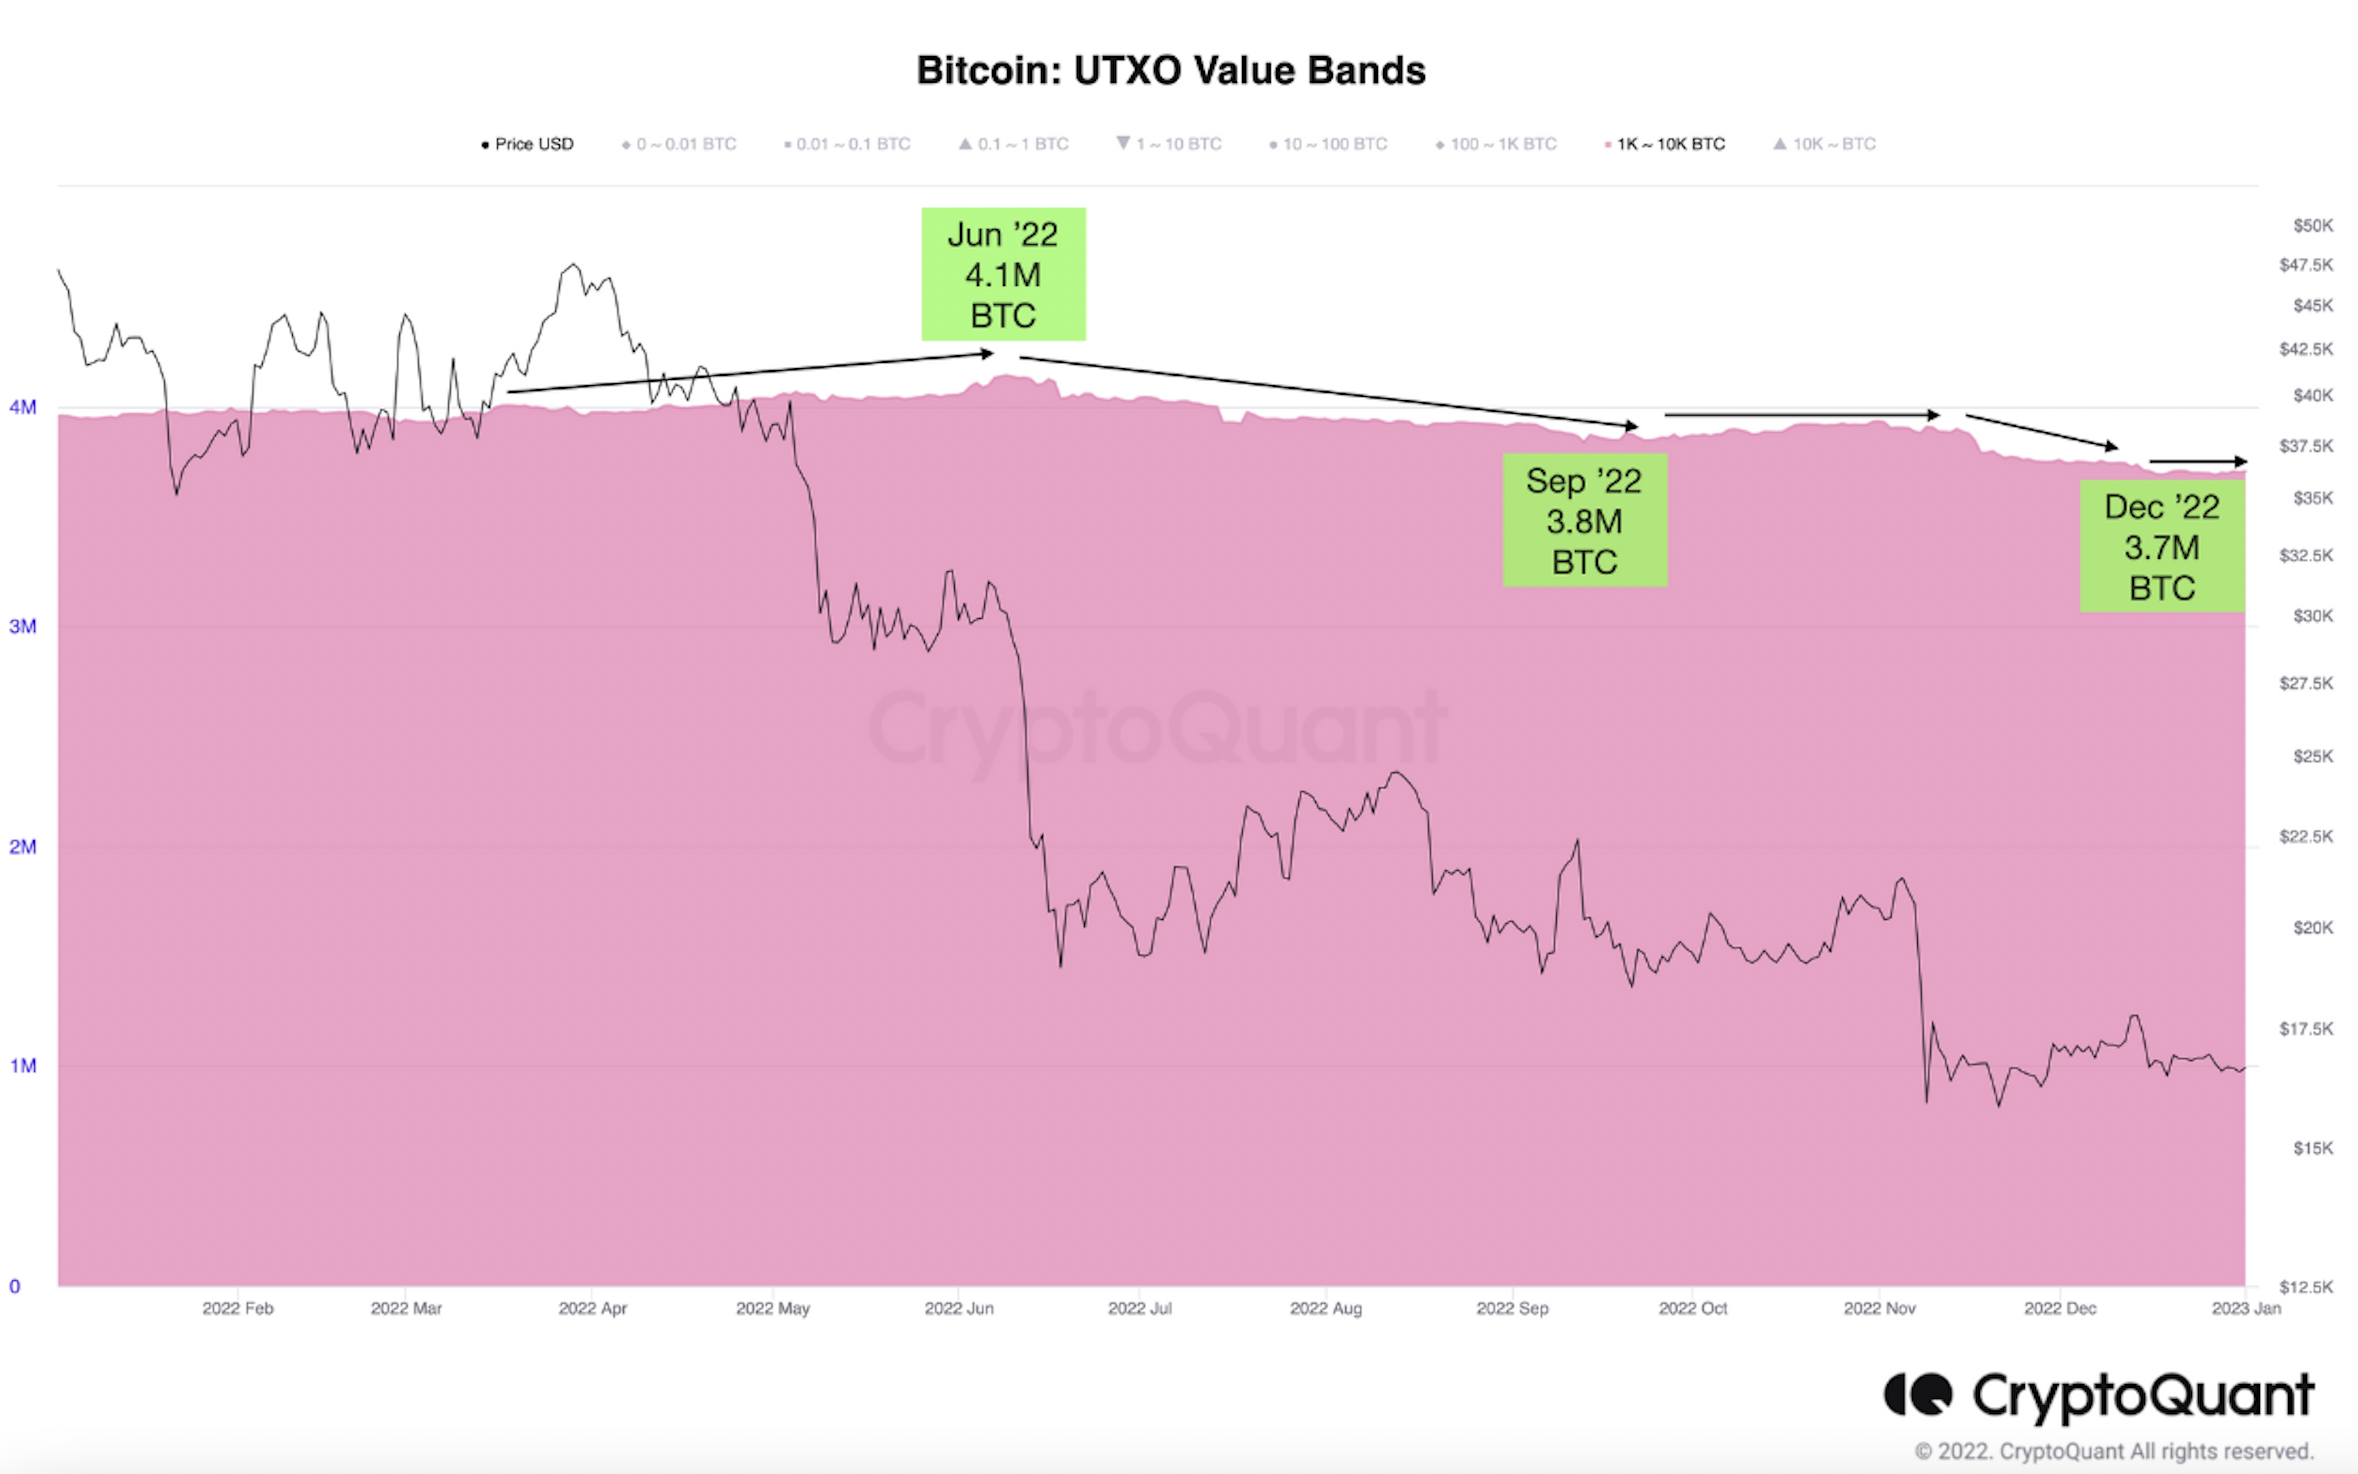
Bitcoin realized price levels and resistance
On-chain analysis reveals large wallet investors have stopped selling their holdings since the beginning of December. This has relieved the selling pressure on the asset, however the holdings amassed by whales are not significant enough to act as a bullish trigger for BTC. In June 2022, Bitcoin whale holdings hit an all-time high and the current value is 10% lower. Based on previous bull runs, Bitcoin price rally is contingent on BTC amassed by large wallet investors.
Author

Ekta Mourya
FXStreet
Ekta Mourya has extensive experience in fundamental and on-chain analysis, particularly focused on impact of macroeconomics and central bank policies on cryptocurrencies.


