Bitcoin Price Forecast: Chances of pullback increase as miner selling ramps up

Bitcoin price today: $87,600
- Bitcoin trades in red on Wednesday, extending losses after reaching a new all-time high of $89,940 on Tuesday.
- Technical indicators suggest the ongoing rally in BTC is overstretched and a corrective pullback could occur.
- BTC’s Miner Position Index reaches a yearly high, signaling miners booking profits and increasing the selling pressure.
Bitcoin (BTC) price extends its decline for a second consecutive day on Wednesday, trading slightly down at around $87,600 after a 30% surge since November 5 pushed BTC to a new all-time high at $89,940. Technical indicators suggest the rally is overstretched, with a potential corrective pullback ahead. Additionally, BTC’s Miner Position Index supports this pullback as it reached a yearly high on Tuesday, signaling miners booking profits and increasing the selling pressure.
Bitcoin dips as miners sell-off weigh
Bitcoin’s recent surge to a new all-time of $89,940 on Tuesday has prompted many investors to take profit, with miners notably contributing to the selling pressure.
The Miner Position Index (MPI) allows the tracking of miners movements. MPI measures the amount of Bitcoin flowing out of miners’ wallets relative to the annual average. A high MPI indicates that miners are withdrawing more Bitcoin than usual. When MPI spikes to extreme levels, forming a peak as seen on the graph below, it often signals that Bitcoin’s price may be approaching a cycle top or ready for a dip.
On Tuesday, the metric spiked to 3.56, marking its yearly high. Historical data reveals that when the MPI reached a similar level of 3.87 on November 10, 2023, Bitcoin dropped over 6% within the next four days. If history repeats, BTC could see a similar price movement.
%20(1)-638670994985971761.png)
Bitcoin Miners Position Index chart. Source: Cryptoquant
Despite miners’ recent sell-off, the spot Bitcoin Exchange Traded Funds (ETFs) launched in January has attracted institutional investors, who have been actively buying BTC ETFs. Continued inflows into BTC ETFs could provide some cushion for price dips. On Tuesday, as Bitcoin dipped, US spot Bitcoin ETFs saw an inflow of $801.70 million, driven largely by BlackRock’s IBIT fund, which contributed $762.50 million, according to Coinglass ETF data.
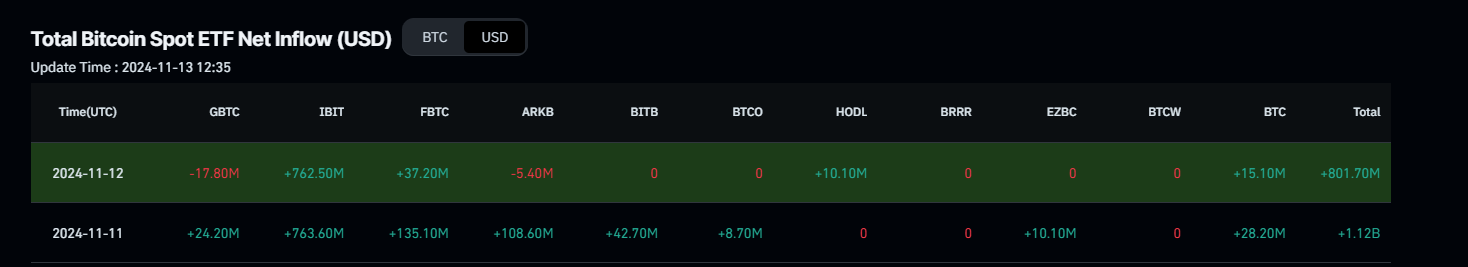
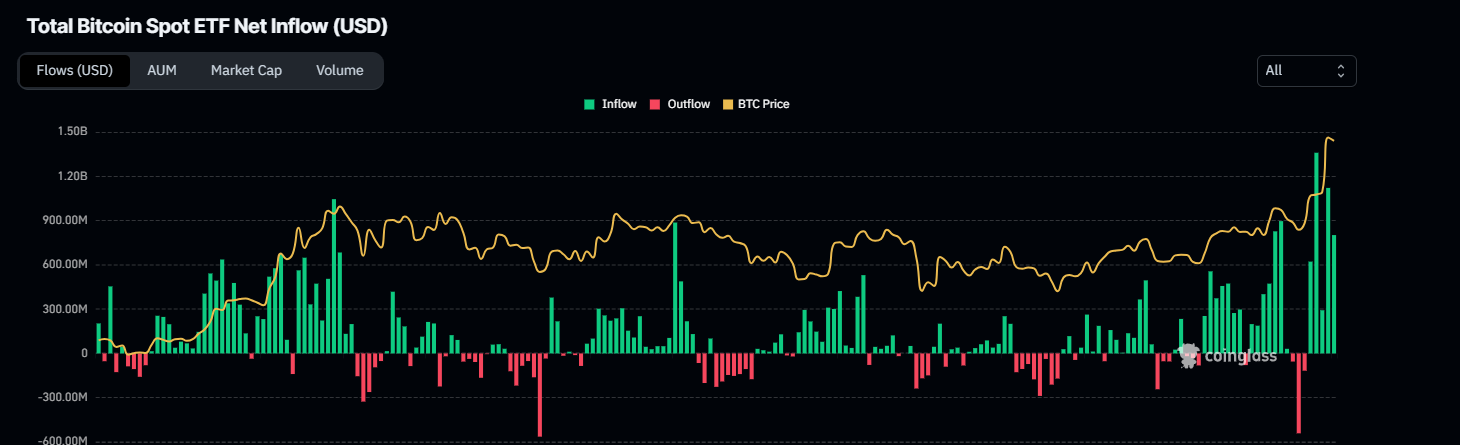
Total Bitcoin Spot ETF Net Inflow chart. Source: Coinglass
“Since the election, gold has declined by 5% while Bitcoin has surged by 30%, signaling a shift as Bitcoin gains traction as “digital gold.” This movement appears increasingly structural, with capital reallocating from traditional safe havens like gold into BTC.”, says QCP Capital’s report.
The report continued, “If even 1% of capital from gold were to flow into BTC, it could propel Bitcoin to around $97k, highlighting the potential upside as this narrative continues to solidify. With BTC just below the critical $90k level, the end-November basis has surged to over 18%, accompanied by strong interest in far-out calls at 110k and 120k strikes. This trend points to heightened demand for margin and leverage as investors position for further breakout potential.”
Bitcoin Price Forecast: BTC bulls show signs of exhaustion
Bitcoin price reached a new all-time of $89,940 on Tuesday after rallying for seven consecutive days, suggesting the rally may be overstretched. At the time of writing on Wednesday, it trades slightly down around $87,600.
The Relative Strength Index (RSI) momentum indicator stands at 80 on the daily chart, well above its overbought level of 70, and points downwards, signaling bullish exhaustion and increasing risk of a correction. Traders should exercise caution when adding to their long positions, as a move out of the overbought territory by the RSI could provide a clear sign of a pullback.
If the ongoing decline continues, BTC’s price could find initial support at $78,807, the 141.40% Fibonacci extension level drawn from July’s high of $70,079 to August’s low of $49,000.
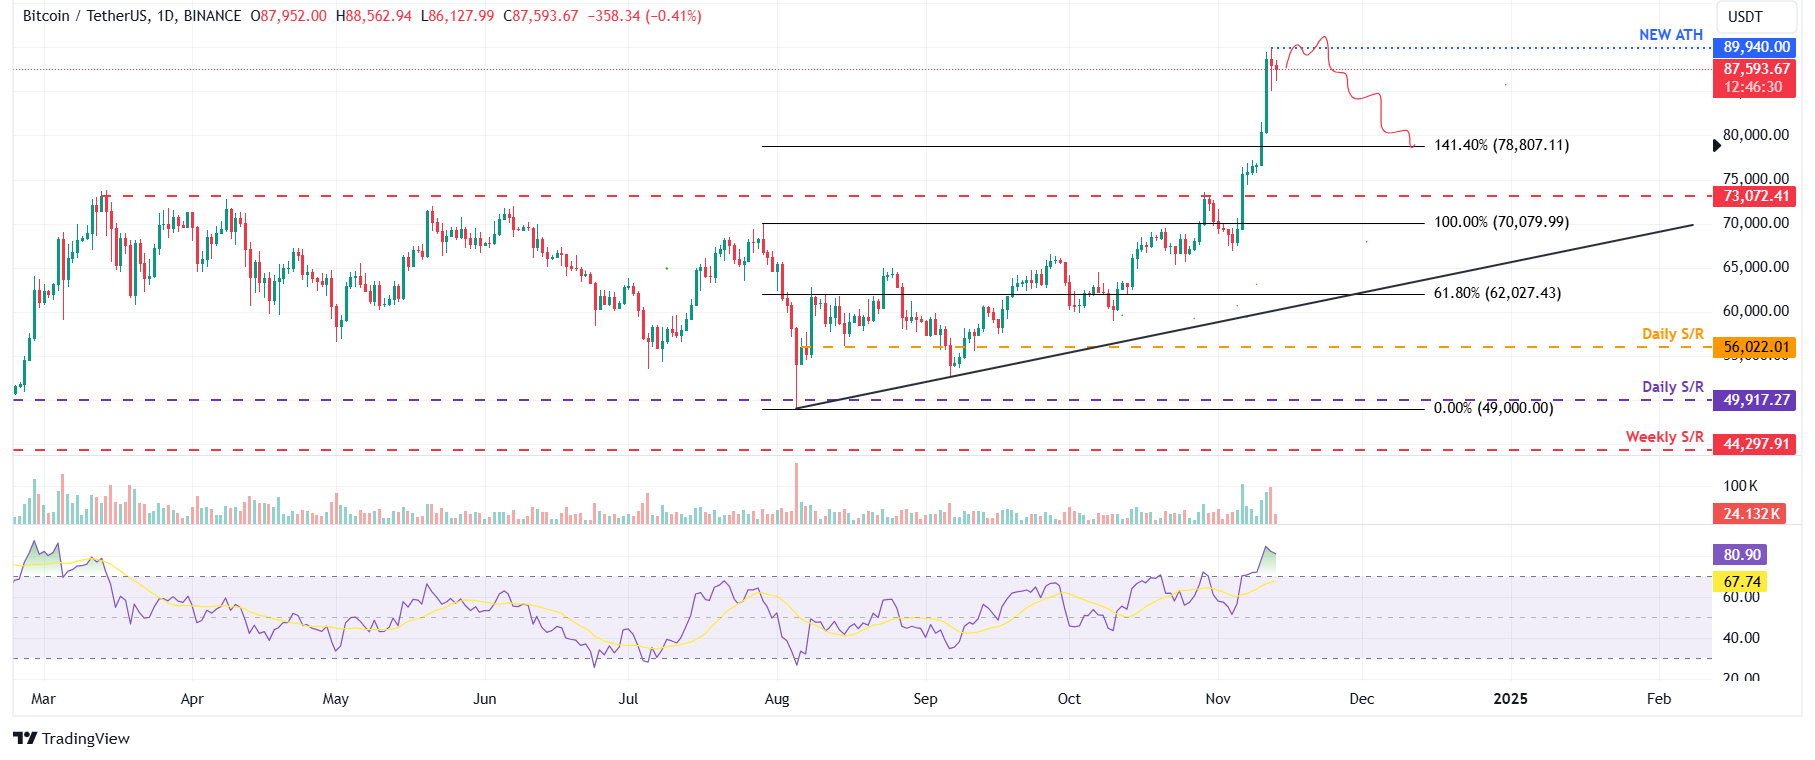
BTC/USDT daily chart
Conversely, if the bulls continue to stretch higher, the rally could extend to retest the 241.40% Fibonacci extension at $99,887.
Bitcoin, altcoins, stablecoins FAQs
Bitcoin is the largest cryptocurrency by market capitalization, a virtual currency designed to serve as money. This form of payment cannot be controlled by any one person, group, or entity, which eliminates the need for third-party participation during financial transactions.
Altcoins are any cryptocurrency apart from Bitcoin, but some also regard Ethereum as a non-altcoin because it is from these two cryptocurrencies that forking happens. If this is true, then Litecoin is the first altcoin, forked from the Bitcoin protocol and, therefore, an “improved” version of it.
Stablecoins are cryptocurrencies designed to have a stable price, with their value backed by a reserve of the asset it represents. To achieve this, the value of any one stablecoin is pegged to a commodity or financial instrument, such as the US Dollar (USD), with its supply regulated by an algorithm or demand. The main goal of stablecoins is to provide an on/off-ramp for investors willing to trade and invest in cryptocurrencies. Stablecoins also allow investors to store value since cryptocurrencies, in general, are subject to volatility.
Bitcoin dominance is the ratio of Bitcoin's market capitalization to the total market capitalization of all cryptocurrencies combined. It provides a clear picture of Bitcoin’s interest among investors. A high BTC dominance typically happens before and during a bull run, in which investors resort to investing in relatively stable and high market capitalization cryptocurrency like Bitcoin. A drop in BTC dominance usually means that investors are moving their capital and/or profits to altcoins in a quest for higher returns, which usually triggers an explosion of altcoin rallies.
Author

Manish Chhetri
FXStreet
Manish Chhetri is a crypto specialist with over four years of experience in the cryptocurrency industry.


