Bitcoin Price Forecast: BTC downside capped at $9,700 – Confluence Detector
- BTC has flashed a buy signal in the 12-hour chart
- Gemini exchange co-founder Tyler Winklevoss believes that Bitcoin is better than gold.

Bitcoin is a better asset than gold – Tyler Winklevoss
Tyler Winkleswoss, the co-founder of Gemini exchange, said that Bitcoin is a better asset than gold.
#Bitcoin is better at being gold than gold — and not just incrementally, but by an order of magnitude or 10X better. pic.twitter.com/rhKOQD44AZ
— Tyler Winklevoss (@tylerwinklevoss) September 21, 2020
Winklevoss's aspects include scarcity, storage, durability, portability, divisibility, counterfeit opportunities, and adoption. Except for adoption (market capitalization), BTC surpasses gold in all metrics.
The cryptocurrency industry, however, has seen an enormous increase in volume over the past decade. This shows that we have not yet seen the mass adoption of digital assets due to their novelty. Although launched initially for transactional purposes, Bitcoin has increasingly become a store of value.
Bitcoin correction is likely a dip to buy – Glassnode CTO
Bitcoin has undergone a significant drop in the past few days as legacy markets have been dragged lower. Rafael Schultze-Kraft, the CTO of Glassnode, said that the ongoing correction is likely a dip to buy. According to a chart he shared, the spent output profit ratio (SOPR) is “flirting with the pivotal level of one.” Generally, when SOPR falls below one in bull markets, investors see it as a medium-term buying opportunity.
Agree with Philip here – in a bull market, this is just a dip (to buy).
— Rafael Schultze-Kraft (@n3ocortex) September 22, 2020
Here's an updated hourly chart (showing adjusted-SOPR).
Bounced back after the dip below one. Will continue watching some more to confirm.#Bitcoin https://t.co/ntJbRkZQLV pic.twitter.com/gi4mWwla6u
Analyst Willy Woo noted that the recent drop was not a standard correction by on-chain standards. There were irregularities in the move lower that may soon be ironed out by Bitcoin returning higher.
This pullback from what I gather looking on-chain took most spot investors off guard, there wasn’t the usual on-chain activity preceding it. Sell off happened at exchanges only. Stocks correlation pulled BTC down its bullish week of breaking free from Stocks.
— Willy Woo (@woonomic) September 22, 2020
Last week, Woo noted that Bitcoin is likely to enter an uptrend because of the recent spike in the “BTC changed hands” metric. Spikes in BTC changing hands on-chain often precedes a reversal in price action, he added.
BTC/USD daily chart
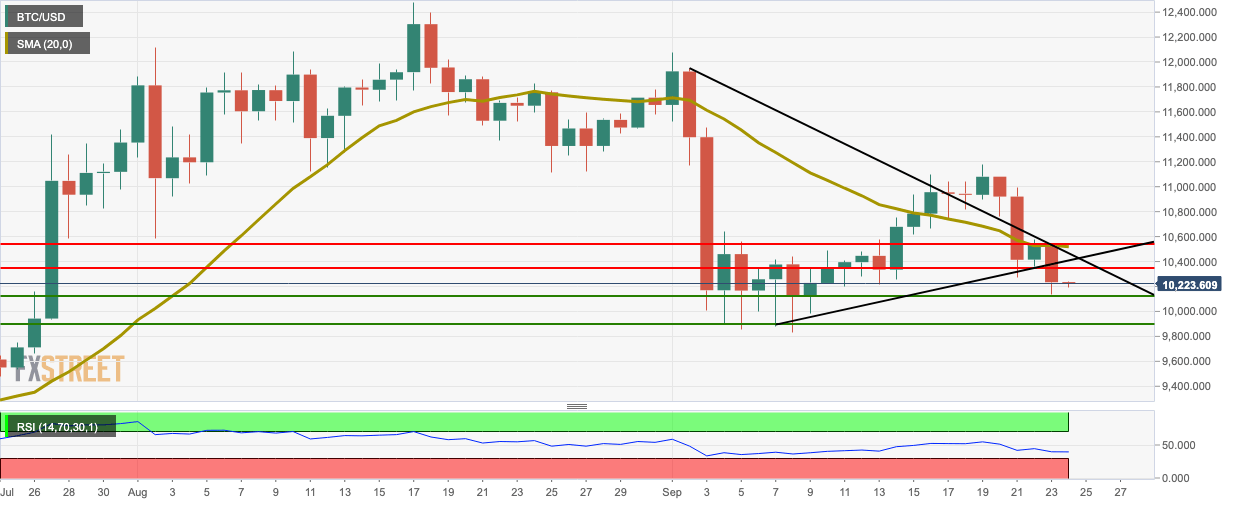
BTC has dropped from $11,085 to $10,265 over the last five days, falling below the symmetrical triangle formation in the process. This Wednesday, the price tumbled down after encountering resistance at the SMA 20 curve.
BTC/USD 12-hour chart
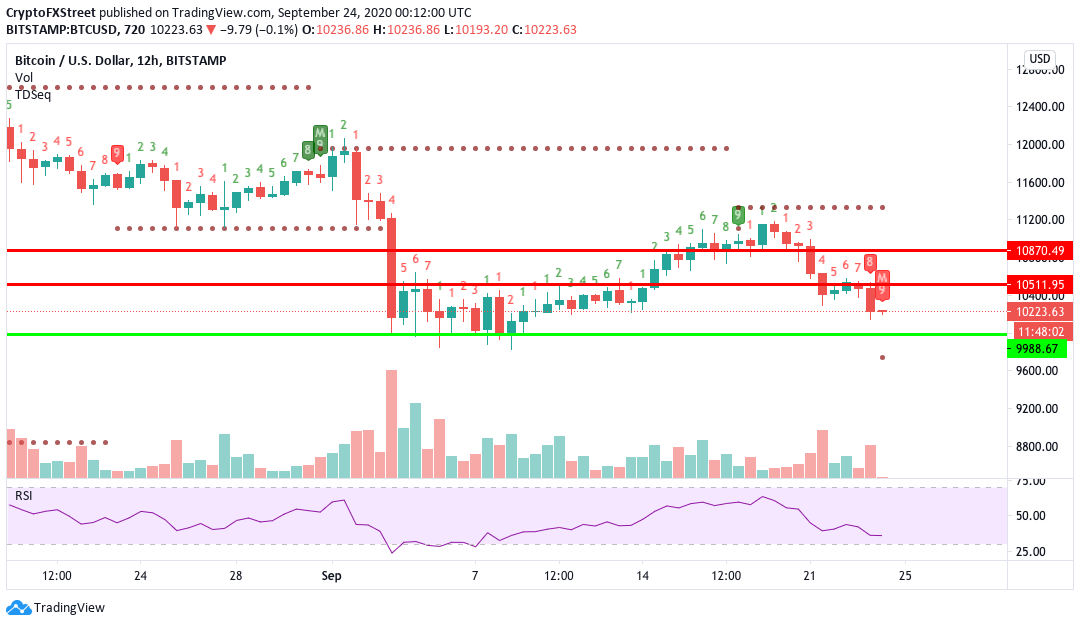
BTC/USD 12-hour chart is flashing a buy signal in the TD sequential. The price has dropped from $11,150 to $10,287 over the last nine sessions. If the buyers make their comeback, they would ideally want to conquer the $10,500 resistance line.
BTC/USD 4-hour chart
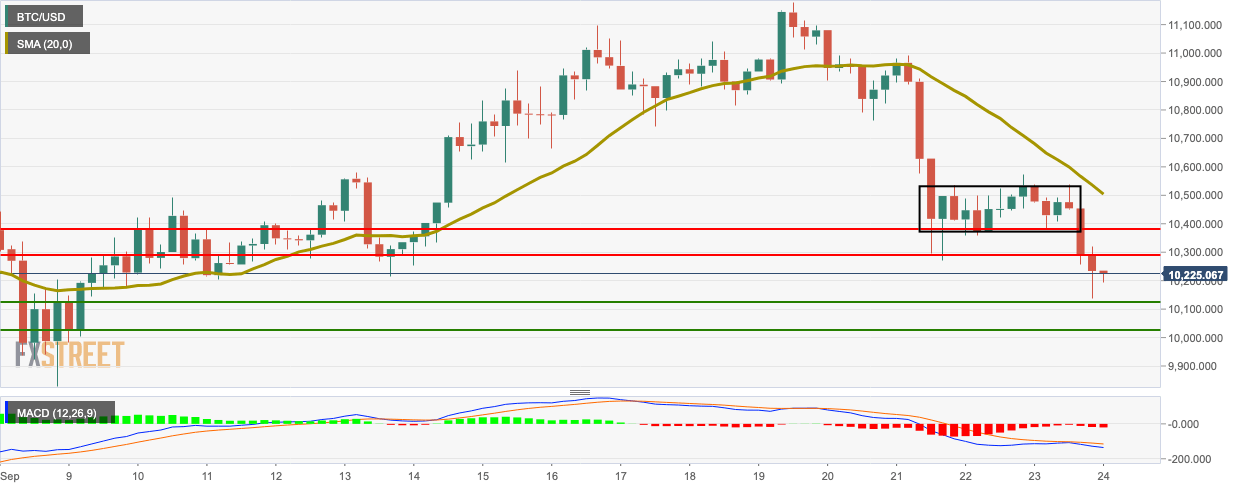
BTC/USD has had a bearish breakout from the consolidation channel. The 4-hour price has broken below the $10,380 and $10,300 support levels in just two sessions. The signal curve was about to cross over the MACD, but the two have since diverged away, showing that the market momentum is still bearish.
BTC hourly chart
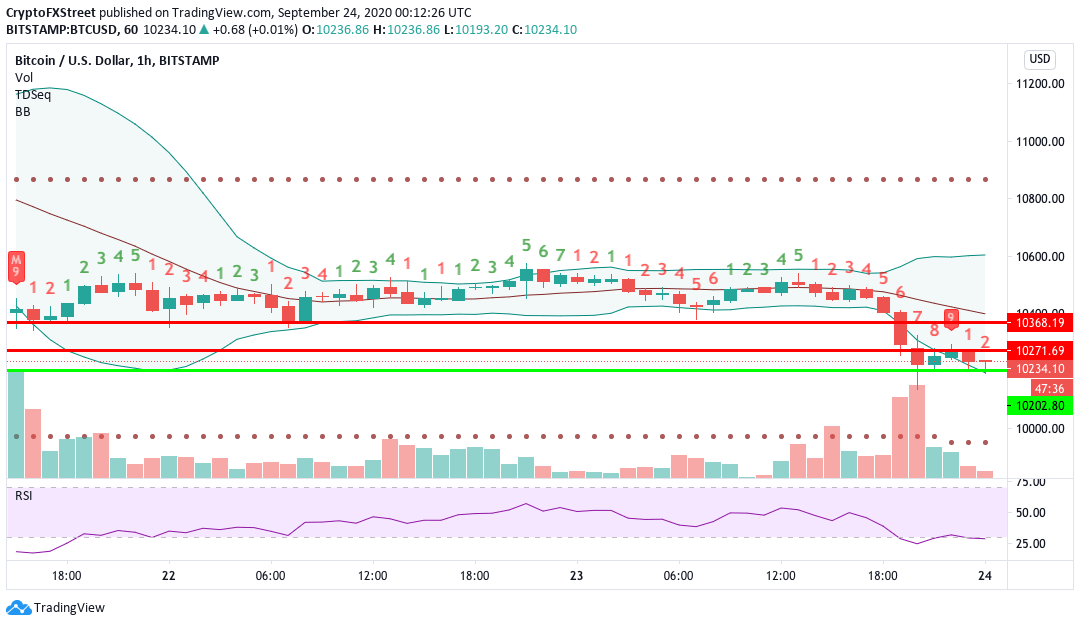
BTC's hourly chart had flashed a buy signal, but the bears have retained control. Currently, the price is sitting on top of the lower curve of the Bollinger Band. The $10,200 support line must remain strong to prevent further downward movement. The RSI has crept into the oversold zone, which may soon trigger the bulls into taking action.
BTC daily confluence detector
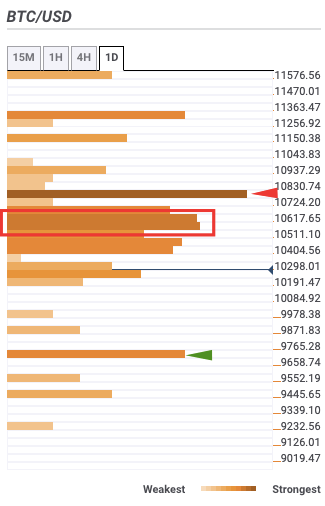
As per the daily confluence detector, the downside is capped off at the $9,700. On the upside, the price faces a robust resistance stack between $10,550-10,650, which has the one-day Previous High and Previous Month low. Above that, there is a stronger resistance level at $10,800.
BTC on-chain
#1 BTC social volume
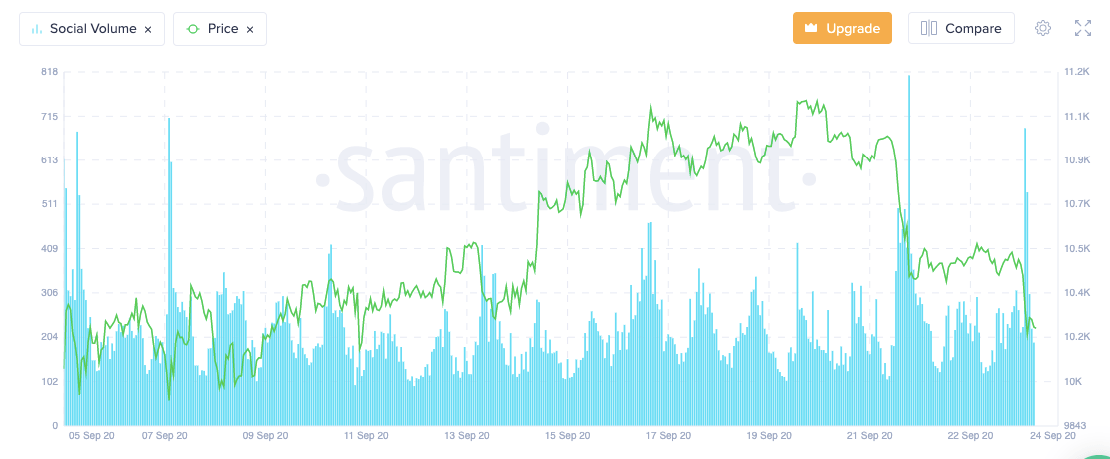
Data from Santiment reveals that the number of BTC-related mentions across different social media networks has experienced significant spikes in the early hours of Thursday. The social volume reached 688 and 539 in the two latest spikes. With the recent falling price, this spike in social media mentions can generally be classified as a FUD. This outcome could benefit those betting on the upsides since assets perform best when social perception is poor.
#2 Daily active addresses
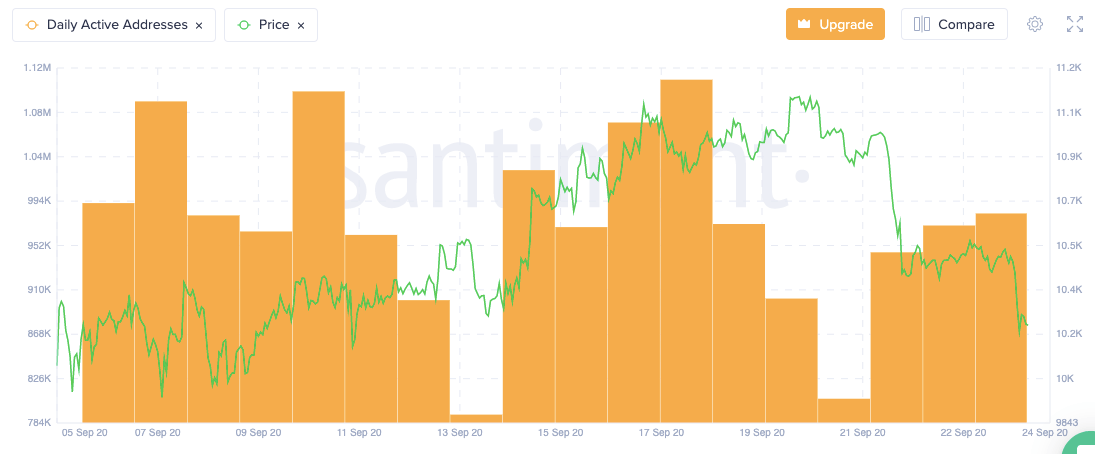
After reaching a low of 806.84k on September 20th, Bitcoin's daily active addresses have climbed significantly over the last three days. Nearly 990,000 Bitcoin addresses were active this Wednesday. This is a positive sign, as it shows that the network is healthy and interactive.
Author

Rajarshi Mitra
Independent Analyst
Rajarshi entered the blockchain space in 2016. He is a blockchain researcher who has worked for Blockgeeks and has done research work for several ICOs. He gets regularly invited to give talks on the blockchain technology and cryptocurrencies.


