Bitcoin Price Forecast: BTC bulls aim for $13,000 as soon as they break past this level
- As per Fidelity Digital Assets, portfolios with larger BTC amounts tend to outperform those with lower amounts.
- Bitcoin whales are selling off their holdings, which could be a worrying sign.

Fidelity Digital Assets (FDA) released an October 2020 report titled “Bitcoin Investment Thesis.” In the report, the investment firm specified Bitcoin's importance as an uncorrelated alternative investment to offer portfolio optimization benefits.
Bitcoin is a unique investable asset with compelling differences relative to traditional asset classes as well as conventional alternative investments that could make it a beneficial addition to a portfolio.
Fidelity simulated sample portfolios with 60% equities and 40% fixed income instruments. The allocations were diversified with Bitcoin at a rate of 1 to 3%. In each of the scenarios, the portfolio holding higher amounts of BTC performed much better.
The technical outlook
Bitcoin rose from $10,600 to $11,500 between October 7 and October 12. Since then, the premier cryptocurrency has been trending horizontally after facing rejection at the $11,700 resistance line. The MACD still shows sustained bullish momentum, so the buyers should be able to break past this level and enter the $13,000 zone.
BTC/USD daily chart
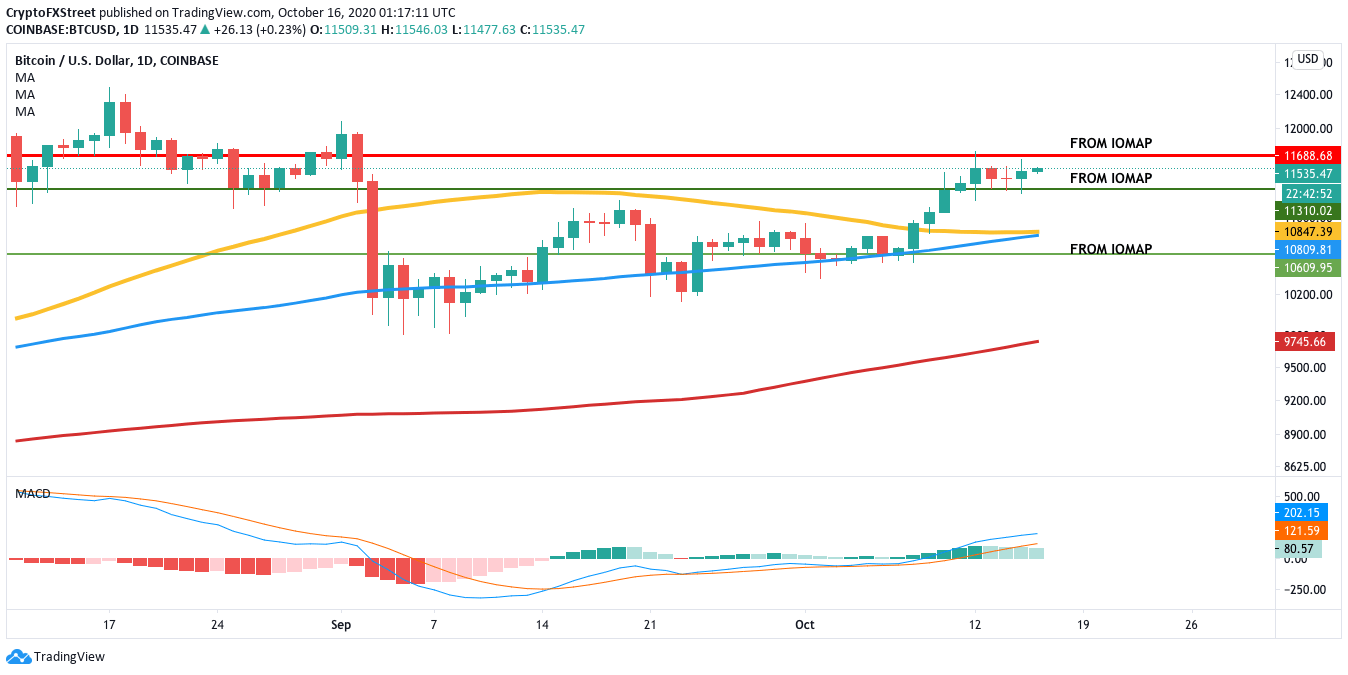
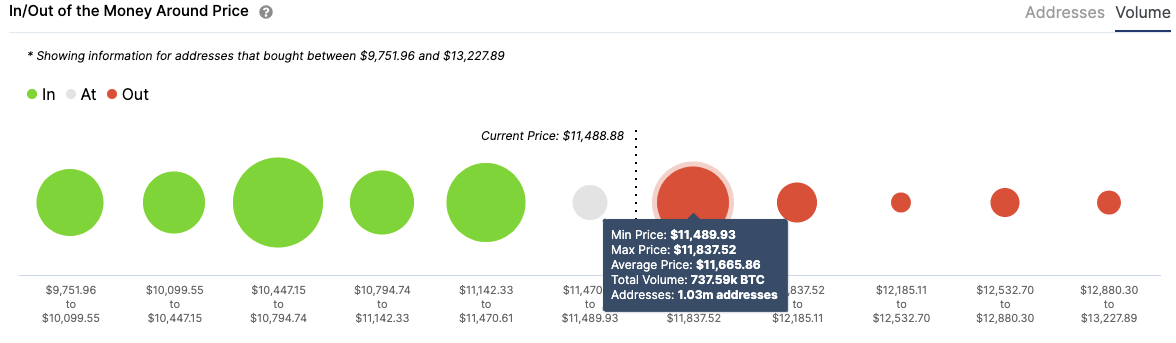
The IOMAP shows that previously at the $11,700 resistance, 1 million addresses purchased 738,000 BTC. If the bulls go past this level, there is a lack of resistance barriers upfront that could potentially hold the price down. As such, the buyers must do whatever they can to quickly flip around the $11,700 line from resistance to support.
BTC IOMAP
The Flipside: Can the bears change the outlook?
The bears can easily take control of the market if the $11,700 resistance continues to hold strong. If the price goes down, the IOMAP shows that there two support walls at $11,300 and $10,600 that should absorb any excessive selling pressure. Between these two walls, Bitcoin has the 50-day SMA and 100-day SMA that provides another layer of support. As such, the downside is severely limited.
Having said that, the action of the whales suggests a spike in selling pressure. As per Santiment’s holders distribution chart, the number of addresses holding 1,000-10,000 tokens fell from 2,108 on September 11 to 2,077 on October 16. Plus, the number of addresses holding 10,000-100,000 tokens dropped from 111 on October 8 to 104 on October 16.
BTC holders distribution
 [06.49.06, 16 Oct, 2020]-637384101298126119.png)
Key price levels to watch
The task that the buyers have is simple. Quickly flip the $11,700 resistance to support and make a break for the $13,000 zone.
On the other hand, the sellers will hope for the $11,700 resistance to stay strong and push BTC's price down as much as they possibly can. However, they face a colossal support wall at $11,300. If they break past it, we can cap off the downside at $10,825, which sees the convergence of the 50-day and 100-day SMAs.
Author

Rajarshi Mitra
Independent Analyst
Rajarshi entered the blockchain space in 2016. He is a blockchain researcher who has worked for Blockgeeks and has done research work for several ICOs. He gets regularly invited to give talks on the blockchain technology and cryptocurrencies.


