|

Bitcoin Price Analysis: Further recovery to gain traction above 61.8% Fib

  • BTC/USD reverses half the Friday’s sell-off, flashing green on Sunday.  
  • BTC bulls look to consolidate before the next push higher.
  • Two consecutive Doji candles on daily chart to be a concern for the bulls?

Bitcoin (BTC/USD), the world’s largest cryptocurrency, consolidates Saturday’s sharp recovery from a drop to 5861.85 lows, as the bulls take a breather before the next push higher. The No.1 coin has reversed half the Friday’s slump to sub-5700 levels and now trades +2% near 6325 region after the recovery fizzled out near 6450. In Sunday’s trading so far, Bitcoin’s market capitalization has increased to $115.35 billion from about $112 billion seen on Saturday while it remains on track to book a 20% weekly gain.

Technical Overview

BTC/USD 1-hour chart

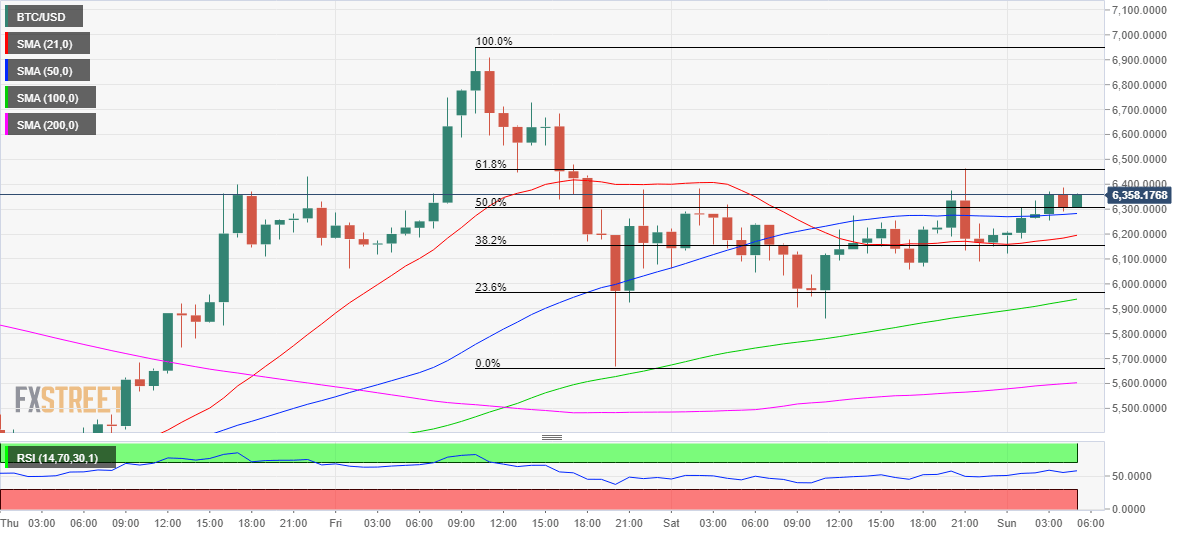
Technically, as observed on the hourly chart, the coin has risen back above all major Simple Moving Averages (HMA), with the immediate upside capped around 6450 region, the 61.8% Fibonacci Retracement level of Friday’s decline (from 6951.22 to 5666.65) and Saturday’s high. A sustained break above the aforementioned resistance will offer a fresh boost to the BTC bulls, as the recovery will regain traction towards a retest of the 7k mark. The hourly Relative Strength Index (RSI) is back above the midline and inches higher, still well below the overbought territory that points to the further upside in store.

On the flip side, the next support is aligned at the horizontal 50-HMA of 6282.45, below which the 6200 area will be tested, the confluence of the 38.2% Fib and upward sloping 21-HMA. Further south, if the 6000 phycological level gives way then the intersection of the 23.6% Fib and 100-HMA between 5965-5940 will come into play.           

However, the upside looks more compelling above the 61.8% level amid a lack of key resistances limiting the bulls. Despite a more optimistic view in the near-term, the spot still remains exposed to downside risks, cautioned by the two consecutive Doji candles formed on the daily chart. Doji candlestick, usually, signals indecision and here it could suggest buyers’ exhaustion following a recovery from yearly lows of 3886.48 reached on March, 13th.  

BTC/USD technical levels to watch

BTC/USD

Overview
Today last price6363.65
Today Daily Change167.56
Today Daily Change %2.70
Today daily open6196.12
 
Trends
Daily SMA207034.51
Daily SMA508574.57
Daily SMA1008246.43
Daily SMA2008446.77
 
Levels
Previous Daily High6463.52
Previous Daily Low5861.86
Previous Weekly High6951.22
Previous Weekly Low4437.02
Previous Monthly High10511.86
Previous Monthly Low8431.17
Daily Fibonacci 38.2%6091.69
Daily Fibonacci 61.8%6233.69
Daily Pivot Point S15884.14
Daily Pivot Point S25572.17
Daily Pivot Point S35282.48
Daily Pivot Point R16485.81
Daily Pivot Point R26775.5
Daily Pivot Point R37087.48

Author

Dhwani Mehta

Dhwani Mehta

FXStreet

Residing in Mumbai (India), Dhwani is a Senior Analyst and Manager of the Asian session at FXStreet. She has over 10 years of experience in analyzing and covering the global financial markets, with specialization in Forex and commodities markets.

More from Dhwani Mehta
Share:

Markets move fast. We move first.

Orange Juice Newsletter brings you expert driven insights - not headlines. Every day on your inbox.

By subscribing you agree to our Terms and conditions.

Editor's Picks

AAVE slips below $186 as bearish signals outweigh the SEC investigation closure

Aave (AAVE) price continues its decline, trading below $186 at the time of writing on Wednesday after a rejection at the key resistance zone. Derivatives positioning and momentum indicators suggest that bearish forces still dominate in the near term.

Hyperliquid stabilizes amid plans to burn assistance fund

Hyperliquid (HYPE) stabilizes above $26 at press time on Wednesday after three straight days of losses. Hyperliquid Foundation has started a validator vote to reduce supply by burning the assistance fund, which holds over 37 million HYPE tokens.

Top 3 Price Prediction: Bitcoin, Ethereum, Ripple extend correction as bearish momentum builds

Bitcoin, Ethereum, and Ripple remain under pressure as the broader market continues its corrective phase into midweek. The weak price action of these top three cryptocurrencies by market capitalization suggests a deeper correction.

Ethereum Price Forecast: Active addresses plunge to May levels amid resumption in US selling pressure

Ethereum (ETH) weekly active addresses have plunged sharply in December, declining from 440K to 324K, levels last visited in May. The decline in active addresses has also pushed down the number of transactions on the network to July lows.

Orange Juice Newsletter – Smart insights by real people. Every day.

A free newsletter highlighting key market trends to help traders stay a step ahead. Daily insights on the most relevant trading topics, compiled by our experts in an easy-to-read format so you never miss an important move.

Bitcoin: Fed delivers, yet fails to impress BTC traders

Bitcoin (BTC) continues de trade within the recent consolidation phase, hovering around $92,000 at the time of writing on Friday, as investors digest the Federal Reserve’s (Fed) cautious December rate cut and its implications for risk assets.