Bitcoin Price Analysis: BTC/USD sellers approach $36,300 on Russia-Ukraine crisis


  • BTC/USD stays pressured around short-term key support after three-week downtrend.
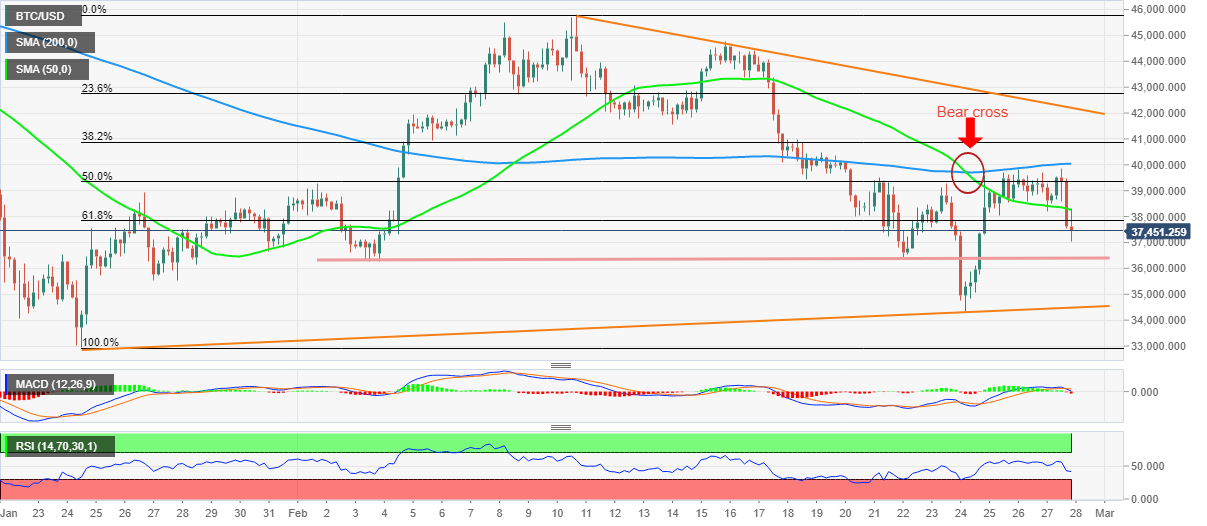
  • Bear cross, downbeat oscillators keep sellers hopeful around 61.8% Fibonacci retracement level.
  • Five-week-old ascending trend line support may test the bears nearby horizontal line.
  • Russian nuclear arsenal on high alert even as Kyiv-Moscow agrees for peace talks.

BTC/USD seesaws around $36,700 during the late Sunday’s trading, after declining for three consecutive weeks in the last.

In doing so, the Bitcoin pair makes rounds to the 61.8% Fibonacci retracement (Fibo.) of the quote’s upside from late January to February 10.

However, 50-SMA’s downside break of the 200-SMA, known as a bear cross, joins the downbeat RSI line and bearish MACD signals to hint at the crypto major’s further downside.

That said, three-week-old horizontal support around $36,300 may restrict the BTC/USD pair’s immediate downside ahead of an upward sloping trend line from January 24, near $34,500 by the press time.

Following that, the late January low near $32,950 will be in focus.

Alternatively, recovery moves need to provide a decisive break above the 200-SMA level of $40,043 to push back the short-term sellers.

Even so, BTC/USD bulls will remain cautious until the pair stays below a descending trend line from February 10, close to $42,000 by the press time.

Read: Risk-off start to week: Russia's Putin puts nuclear deterrence forces on high alert

BTC/USD: Four-hour chart

Trend: Further weakness eyed

Additional important  levels

Overview
Today last price 37844.26
Today Daily Change -1294.12
Today Daily Change % -3.31%
Today daily open 39138.38
 
Trends
Daily SMA20 41296.04
Daily SMA50 40444.1
Daily SMA100 45691
Daily SMA200 49208.08
 
Levels
Previous Daily High 39819.92
Previous Daily Low 38596.74
Previous Weekly High 40141.76
Previous Weekly Low 34326.49
Previous Monthly High 47983.92
Previous Monthly Low 32962.74
Daily Fibonacci 38.2% 39063.99
Daily Fibonacci 61.8% 39352.67
Daily Pivot Point S1 38550.11
Daily Pivot Point S2 37961.83
Daily Pivot Point S3 37326.92
Daily Pivot Point R1 39773.29
Daily Pivot Point R2 40408.2
Daily Pivot Point R3 40996.48


Information on these pages contains forward-looking statements that involve risks and uncertainties. Markets and instruments profiled on this page are for informational purposes only and should not in any way come across as a recommendation to buy or sell in these assets. You should do your own thorough research before making any investment decisions. FXStreet does not in any way guarantee that this information is free from mistakes, errors, or material misstatements. It also does not guarantee that this information is of a timely nature. Investing in Open Markets involves a great deal of risk, including the loss of all or a portion of your investment, as well as emotional distress. All risks, losses and costs associated with investing, including total loss of principal, are your responsibility. The views and opinions expressed in this article are those of the authors and do not necessarily reflect the official policy or position of FXStreet nor its advertisers. The author will not be held responsible for information that is found at the end of links posted on this page.

If not otherwise explicitly mentioned in the body of the article, at the time of writing, the author has no position in any stock mentioned in this article and no business relationship with any company mentioned. The author has not received compensation for writing this article, other than from FXStreet.

FXStreet and the author do not provide personalized recommendations. The author makes no representations as to the accuracy, completeness, or suitability of this information. FXStreet and the author will not be liable for any errors, omissions or any losses, injuries or damages arising from this information and its display or use. Errors and omissions excepted.

The author and FXStreet are not registered investment advisors and nothing in this article is intended to be investment advice.

Recommended content


Recommended Content

Editors’ Picks

Bitcoin Weekly Forecast: BTC shows weakness, bears aiming for $90,000 mark

Bitcoin Weekly Forecast: BTC shows weakness, bears aiming for $90,000 mark

Bitcoin (BTC) price hovers around $97,000 on Friday after losing nearly 5% in the last three days. CryptoQuant weekly report shows that activity on the Bitcoin network has declined to its lowest level in a year. 

More Bitcoin News
ONDO Price Forecast: Ondo Chain launched while TVL rises to $654 million

ONDO Price Forecast: Ondo Chain launched while TVL rises to $654 million

Ondo price is nearing its key weekly resistance of $1.38 on Friday, and a firm close above this level hints at a rally ahead. Ondo launches its Ondo Chain, a new Layer 1 blockchain purpose-built for institutional-grade RWAs.

More Ondo News
Top 3 Price Prediction Bitcoin, Ethereum, Ripple: BTC, ETH and XRP are at risk of for further declines

Top 3 Price Prediction Bitcoin, Ethereum, Ripple: BTC, ETH and XRP are at risk of for further declines

Bitcoin (BTC) hovers around $97,400 on Friday after losing nearly 5% in the last three days. Ethereum (ETH) and Ripple (XRP) fail to recover and face rejection from their key levels, hinting at further corrections.

More Cryptocurrencies News
XRP ETF gains traction as SEC acknowledges Grayscale filing for Solana and Litecoin funds

XRP ETF gains traction as SEC acknowledges Grayscale filing for Solana and Litecoin funds

Ripple's XRP was in the limelight on Thursday following the Chicago Board Options Exchange (Cboe) 19b-4 filing to the SEC to list and begin trading XRP exchange-traded funds (ETFs) for asset managers Canary Capital, WisdomTree, 21Shares and Bitwise. 

More Ripple News
Bitcoin: BTC shows weakness, bears aiming for $90,000 mark

Bitcoin: BTC shows weakness, bears aiming for $90,000 mark

Bitcoin (BTC) price hovers around $97,000 on Friday after losing nearly 5% in the last three days. CryptoQuant weekly report shows that activity on the Bitcoin network has declined to its lowest level in a year. Traders should watch FTX's upcoming repayments to creditors starting on February 18, which could bring in volatility for Bitcoin prices.

Read full analysis
The Best Brokers of the Year

The Best Brokers of the Year

SPONSORED Explore top-quality choices worldwide and locally. Compare key features like spreads, leverage, and platforms. Find the right broker for your needs, whether trading CFDs, Forex pairs like EUR/USD, or commodities like Gold.

Read More

BTC

ETH

XRP