Bitcoin Price Analysis: BTC recovery has legs to retake $58,000
- Bitcoin keeps bounce off 21-day EMA, monthly support line despite easing below $57,000 off-late.
- Bullish MACD, strong RSI join decisive U-turn from the key support confluence to favor buyers.
- Seven-week-old ascending trend line adds to the downside filters, bulls eye horizontal area comprising February tops.

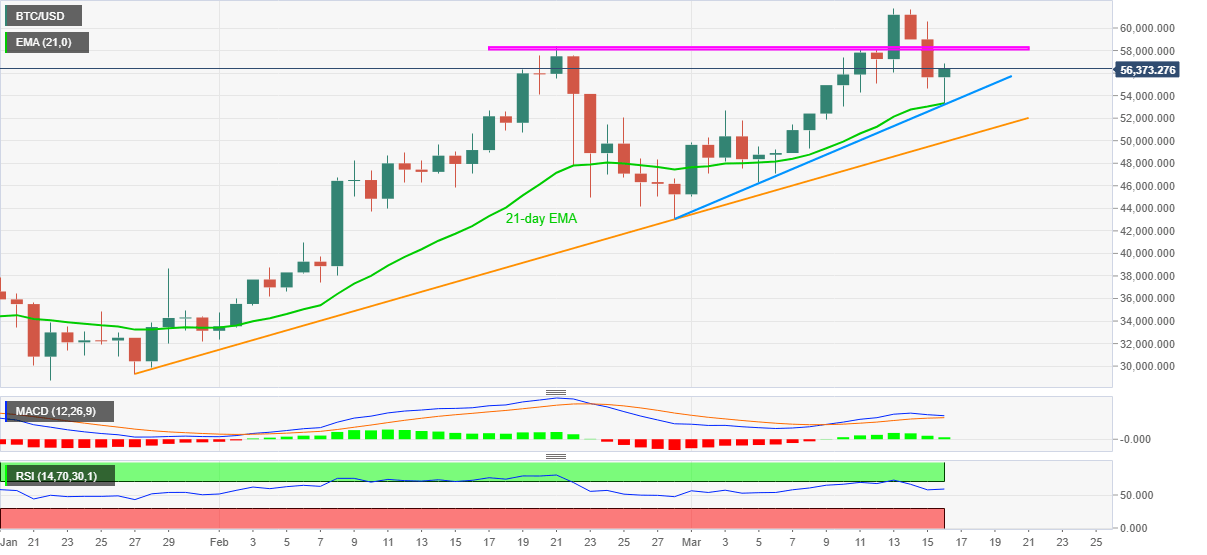
BTC/USD bulls catch a breather around $56,300 during the early Wednesday after the previous day’s stellar recovery from 21-day EMA and an ascending trend line from February 28. In doing so, the cryptocurrency major snapped the two-day losing streak while keeping the buyers hopeful amid upbeat RSI and MACD signals.
Against this backdrop, Bitcoin currently eyes to regain the $57,000 threshold while tops marked in February and during last week, around $58,100-300, should test the quote’s further upside.
Should BTC/USD bulls keep the reins above $58,300 on a daily closing basis, the recently refreshed record top of $61,774 will be their next target.
Meanwhile, a downside break of $53,330 support confluence isn’t a call to the BTC/USD sellers as the $50,000 round-figure and an upward sloping trend line from January 27, currently around $49,880 stand tall to challenge the bears.
It should, however, be noted that a clear break below $49,880 may not hesitate to direct BTC/USD bears towards the late February low near $43,000.
BTC/USD daily chart
Trend: Further recovery expected
Author

Anil Panchal
FXStreet
Anil Panchal has nearly 15 years of experience in tracking financial markets. With a keen interest in macroeconomics, Anil aptly tracks global news/updates and stays well-informed about the global financial moves and their implications.


