Bitcoin Price Analysis: BTC decouples from the S&P 500, bulls double it down
- Bitcoin's correlation to the US stock market has reduced to zero for the first time since May.
- The positive momentum may be at risk due to a high level of uncertainty.
- A sustainable move above $13,250 will take BTC to the moon.

Bitcoin (BTC) recovered above $13,000 and hit the intraday high at $13,361 on Sunday. By the time of writing, BTC/USD retreated to $13,230, but the market optimism remains strong after a sustainable move above the psychological barrier of $13,000. The pioneer digital currency has gained over 2% in recent 24 hours and over 16% on a week-to-week basis.
Bitcoin's average daily trading volume is registered at $26 billion, while its market share settled at 61%.
Bitcoin's correlation with the S&P 500 drops to zero
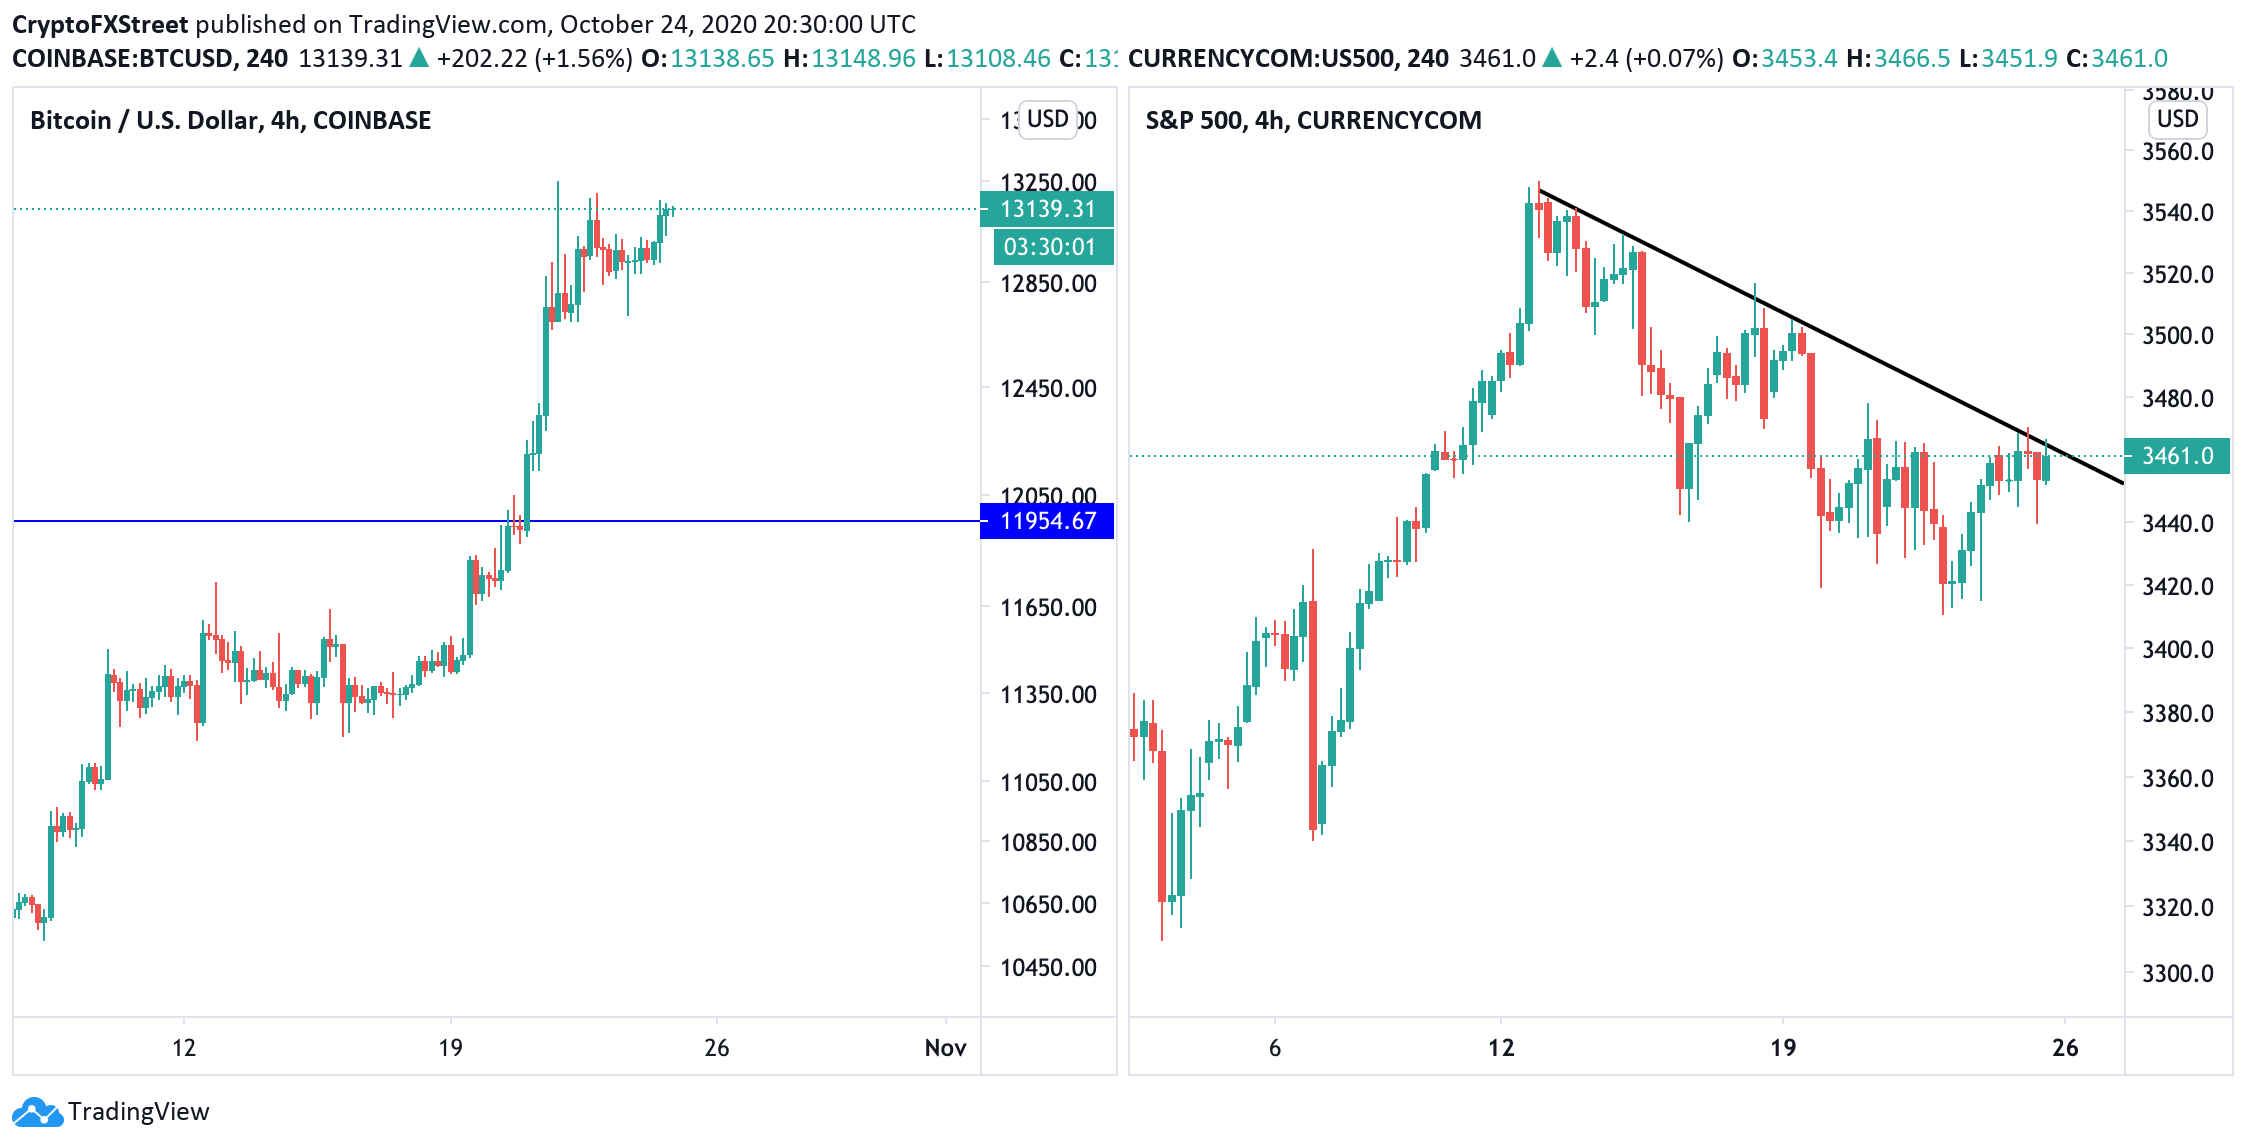
Bitcoin has been moving in lockstep with the US stock market for quite a while. However, the wicked correlation seems to be broken now as the pioneer cryptocurrency has been on the trip to the North since October 19, while the S&P 500 has been going down.
According to the on-chain data provider Santiment, Bitcoin's correlation to the S&P 500 dropped to zero for the first time since May, which is a positive signal for the cryptocurrency market. The story goes that the decoupling from the traditional asset classes is beneficial to Bitcoin as it is regarded as a non-correlated diversification tool.
1) With #Bitcoin's +14.1% price surge this past week, its correlation to the #SP500 has dropped back to 0 for the first time since May on our 30-day rolling average model. This is a great sign for #crypto after having an all-time high correlation in August. $BTC has historically pic.twitter.com/4ARUlexTfZ
— Santiment (@santimentfeed) October 24, 2020
As the chart below shows, the S&P 500 has lost 2.5% (from 3550 to 3460) since October 12. Bitcoin has gained 14% in the same period. From the economic point of view, BTC stops falling in sync with stocks when the focus of attention shifts from the global uncertainties and financial woes to inflation concerns. In this case, the equities and other risk assets continue going down, while Bitcoin is growing due to its natural deflationary features.
Bitcoin and S&P 500 4-hour charts
However, it should be noted that the recent decoupling may be partially caused by a cascade of positive events on the cryptocurrency markets. We still have many uncertainties ahead as the US is moving into the Presidential elections, and the COVID-19 pandemic is spreading across the globe like a wildfire again. In these circumstances, it is better to stay cautious and pay attention to technical and on-chain data.
BTC/USD: The technical picture
On the daily chart, BTC/USD escaped from a narrow range and settled above the psychological barrier of $13,000. The further recovery is limited by the previous high of $13,250, while the former channel resistance creates critical support.
BTC/USD daily chart
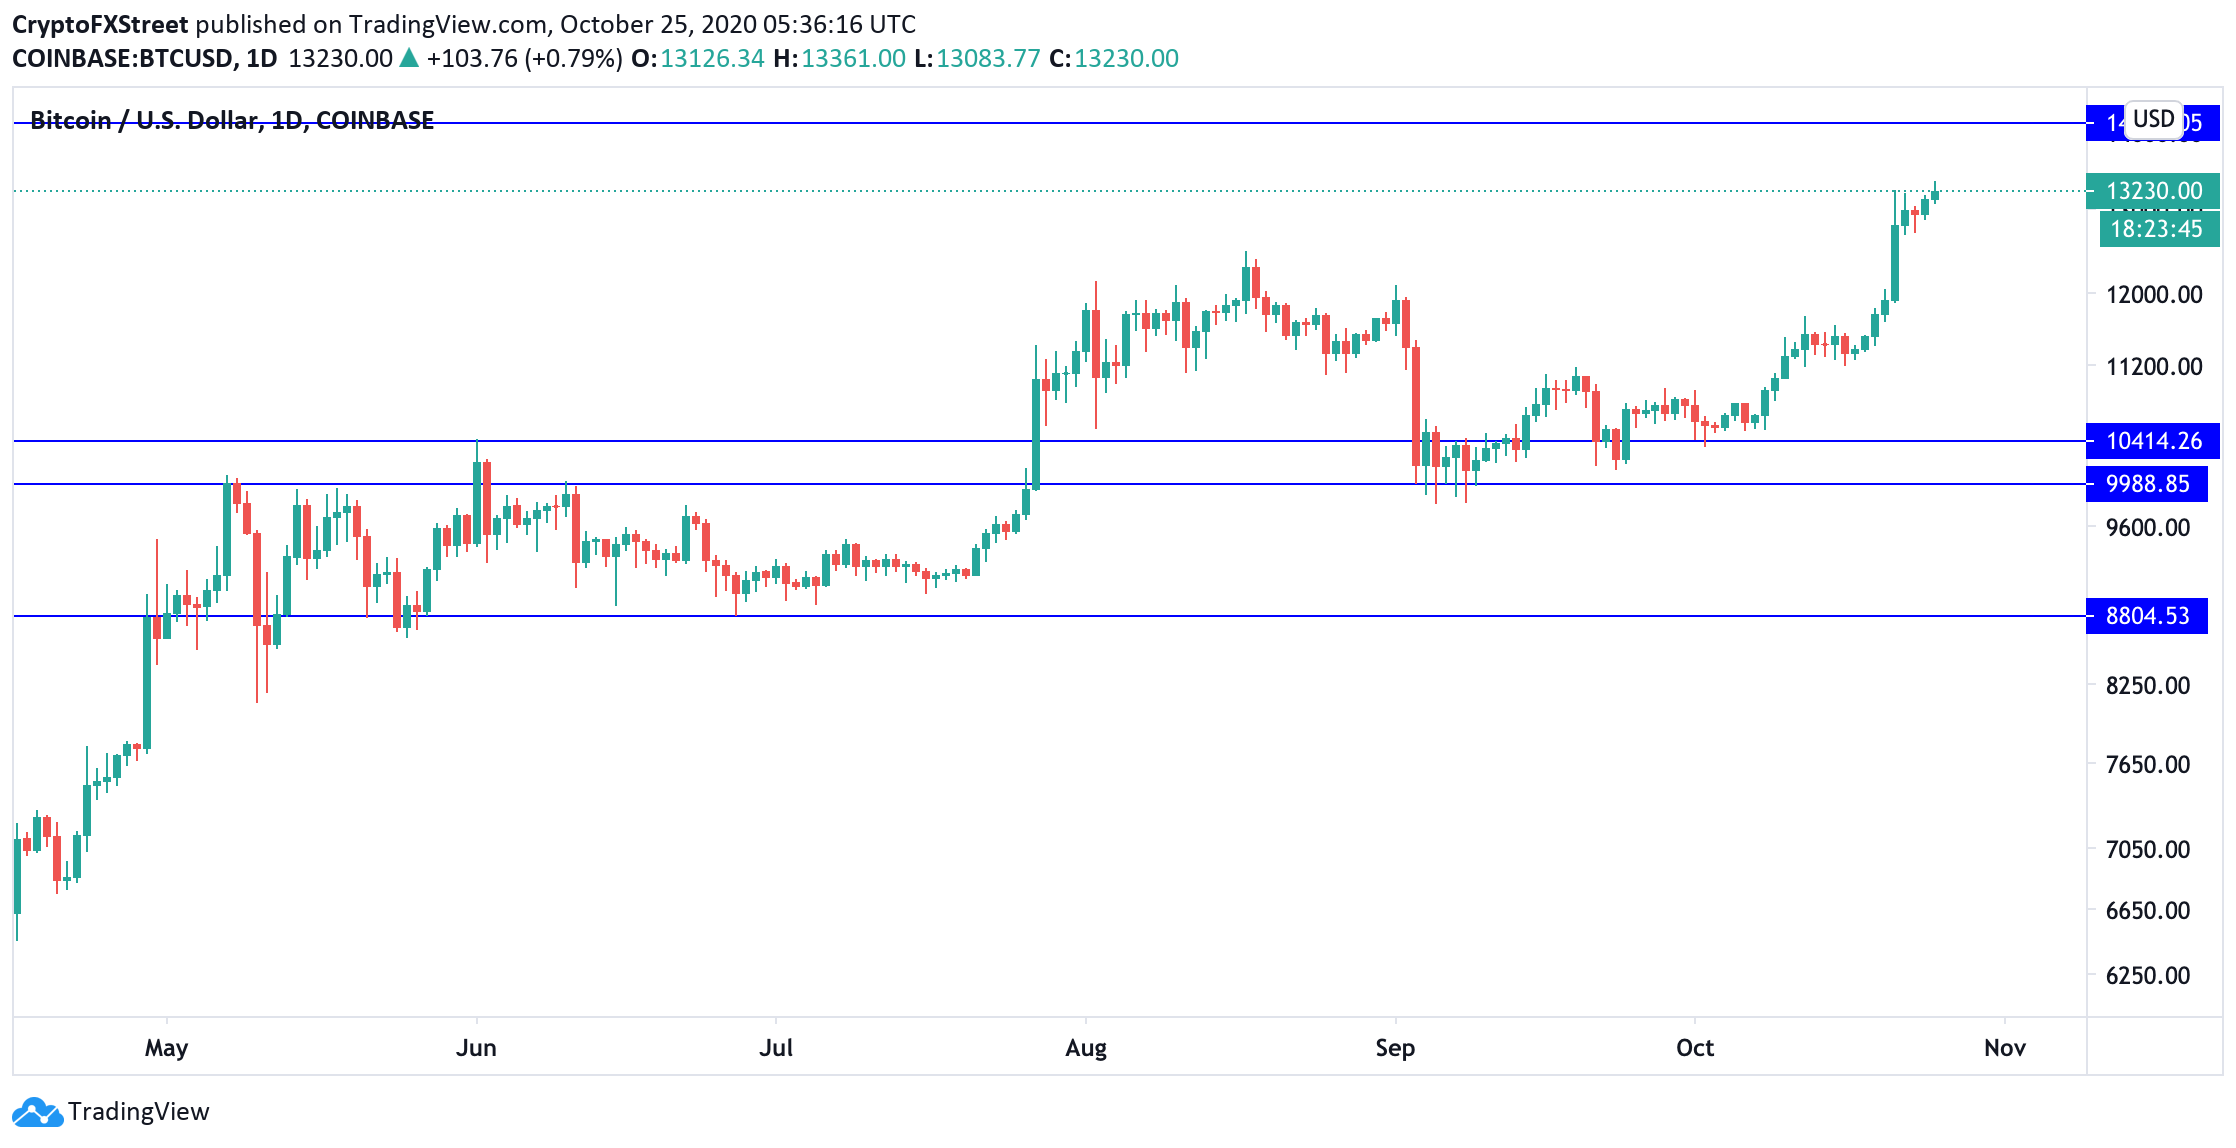
If BTC/USD fails to stay above $13,000, the recovery may be extended towards the broken channel support of $12,750; however, the upside trend remains intact as long as the price stays above $12,000. This line in the sand has been limiting Bitcoin's recovery since the beginning of August and served as a significant psychological area, separating BTC from a new bullish trend.
The In and Out of the Money Positioning (IOMP) data confirm that there is local support on approach to $12,750. However, a much bigger cluster of addresses may start protecting their breakeven price on approach to $11,900, which is in line with the technical picture.
Bitcoin's IOMP data
 Analytics and Charts 2510-637392016494272885.png)
Source: Intotheblock
On the upside, a sustainable move above the recent high of $13,361 brings $14,000 in focus. The market positioning data shows that there are no significant barriers above the current price, meaning that the upside is the path of least resistance now.
BTC/USD: Key levels to watch
Considering the on-chain data and technical indicators, BTC will continue moving upwards if a move above $13,000 is sustained. The decoupling from the US stock market sends a positive signal for the cryptocurrency universe; however, traders need to be cautious due to the high level of uncertainty in the global economy and geopolitics.
A move below $12,750 will invalidate the short-term bullish scenario and bring more sellers to the market with the potential downside aims of $12,000, where a new buying interest is likely to appear.
Author

Tanya Abrosimova
Independent Analyst


