Bitcoin Price Analysis: BTC bull-bear tug-of-war to extend circa $9100 – Confluence Detector

After Wednesday’s sharp dive, Bitcoin (BTC/USD) consolidated the minor recovery around $9100 mark on Friday amid sluggish trading conditions across the crypto space. The most favorite digital coin is likely to extend its range play amid a long weekend holiday break in the US.
At the press time, it enjoys a market capitalization of $167.23 billion and trades around $9090, modestly flat on the day.
The Technical Confluences Indicator shows that the bulls and bears continue to fight for control, as the No. 1 crypto coin remains trapped between two key barriers so far this Saturday.
A break above the $9115 level is critical to re-ignite the recovery momentum from Thursday’s slump below the $9000 threshold. That resistance is the confluence of the Bollinger Band one-hour Middle, Fibonacci 61.8% one-day and 10 SMA on four-hour.
Up next, a minor resistance around $9140, where SMA 200 one-hour and SMA 50 four-hour intersect, could slow down the upside break.
Should the bulls clear the aforesaid barrier, another healthy barrier will come into play at $9200, the convergence of the Fibonacci 23.16% one-month and pivot point one-day R3.
On the other side, the $9080 level is testing the bears’ commitment once again. The support area is critical, as it is the confluence of Fibonacci 61.8% one-week, Fibonacci 38.2% one-day and SMA 5, 10 on one-hour.
A failure to resist above the latter could open floors towards $8945, the intersection of the previous week low, pivot point one-day S3 and Bollinger Band one-day Lower.
Here is how it looks on the tool
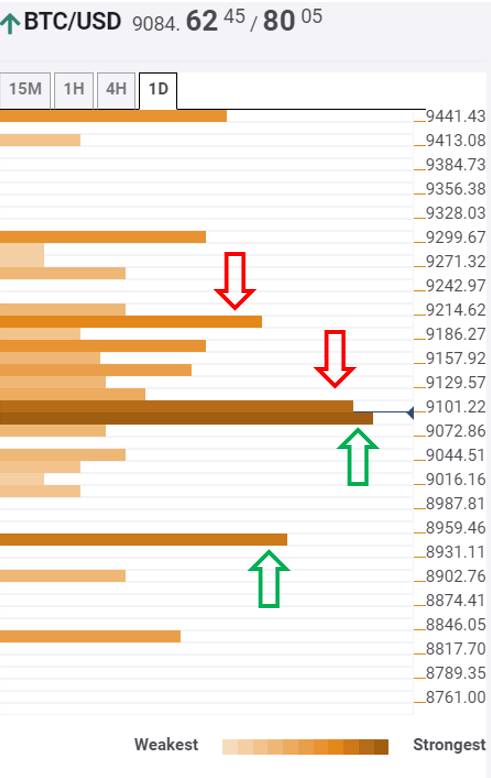
Confluence Detector
The Confluence Detector finds exciting opportunities using Technical Confluences. The TC is a tool to locate and point out those price levels where there is a congestion of indicators, moving averages, Fibonacci levels, Pivot Points, etc. Knowing where these congestion points are located is very useful for the trader, and can be used as a basis for different strategies.
This tool assigns a certain amount of “weight” to each indicator, and this “weight” can influence adjacents price levels. These weightings mean that one price level without any indicator or moving average but under the influence of two “strongly weighted” levels accumulate more resistance than their neighbors. In these cases, the tool signals resistance in apparently empty areas.
Author

Dhwani Mehta
FXStreet
Residing in Mumbai (India), Dhwani is a Senior Analyst and Manager of the Asian session at FXStreet. She has over 10 years of experience in analyzing and covering the global financial markets, with specialization in Forex and commodities markets.




