Bitcoin may 'take out' previous $53K lows before bulls regain control, says trader

A night of losses pressures bulls as liquidations mount up and $46,000 support looms large.
Bitcoin (BTC) dropped to its lowest in two weeks on March 23 amid fears that bulls were running out of appetite to buy.
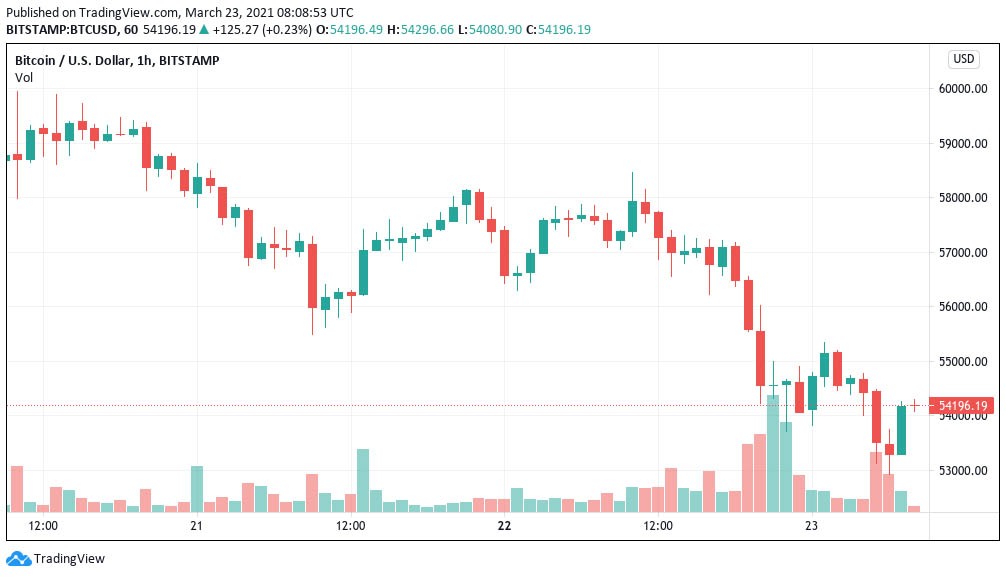
BTC/USD 1-hour candle chart (Bitstamp). Source: Tradingview
BTC price bounces at $53,000
Data from Cointelegraph Markets Pro and Tradingview showed BTC/USD hitting local lows of $53,125 on Bitstamp overnight.
The latest hit to the 2021 bull run this month, Tuesday’s dip brought the prospect of a $50,000 test ever closer, with buyer support on exchanges looking increasingly shaky.
Data from Binance’s orderbook confirmed support at $53,000, but should this crumble, only definitive demand at $46,000 remains to halt the retracement.
“Expecting the previous lows in BTC to be taken out before we can see a significant bounce,” trader Crypto Ed summarized, forecasting an upcoming move below $53,000.
“This bull-run isn't over yet. I'm ready to buy the dip,” Ki Young Ju, CEO of on-chain analytics service CryptoQuant, argued, striking a more upbeat tone.
“But I'll patiently wait till on-chain supply/demand indicators say ‘all-in.’”
Ki referred to high selling pressure on spot exchanges keeping upside in check, but was representative of the broader mood among traders on the day, who overwhelmingly classed recent price action as a standard consolidatory move rather than capitulation.
In their favor was hodler behavior, which saw more BTC taken off exchanges in recent days than at any point in the past six weeks.
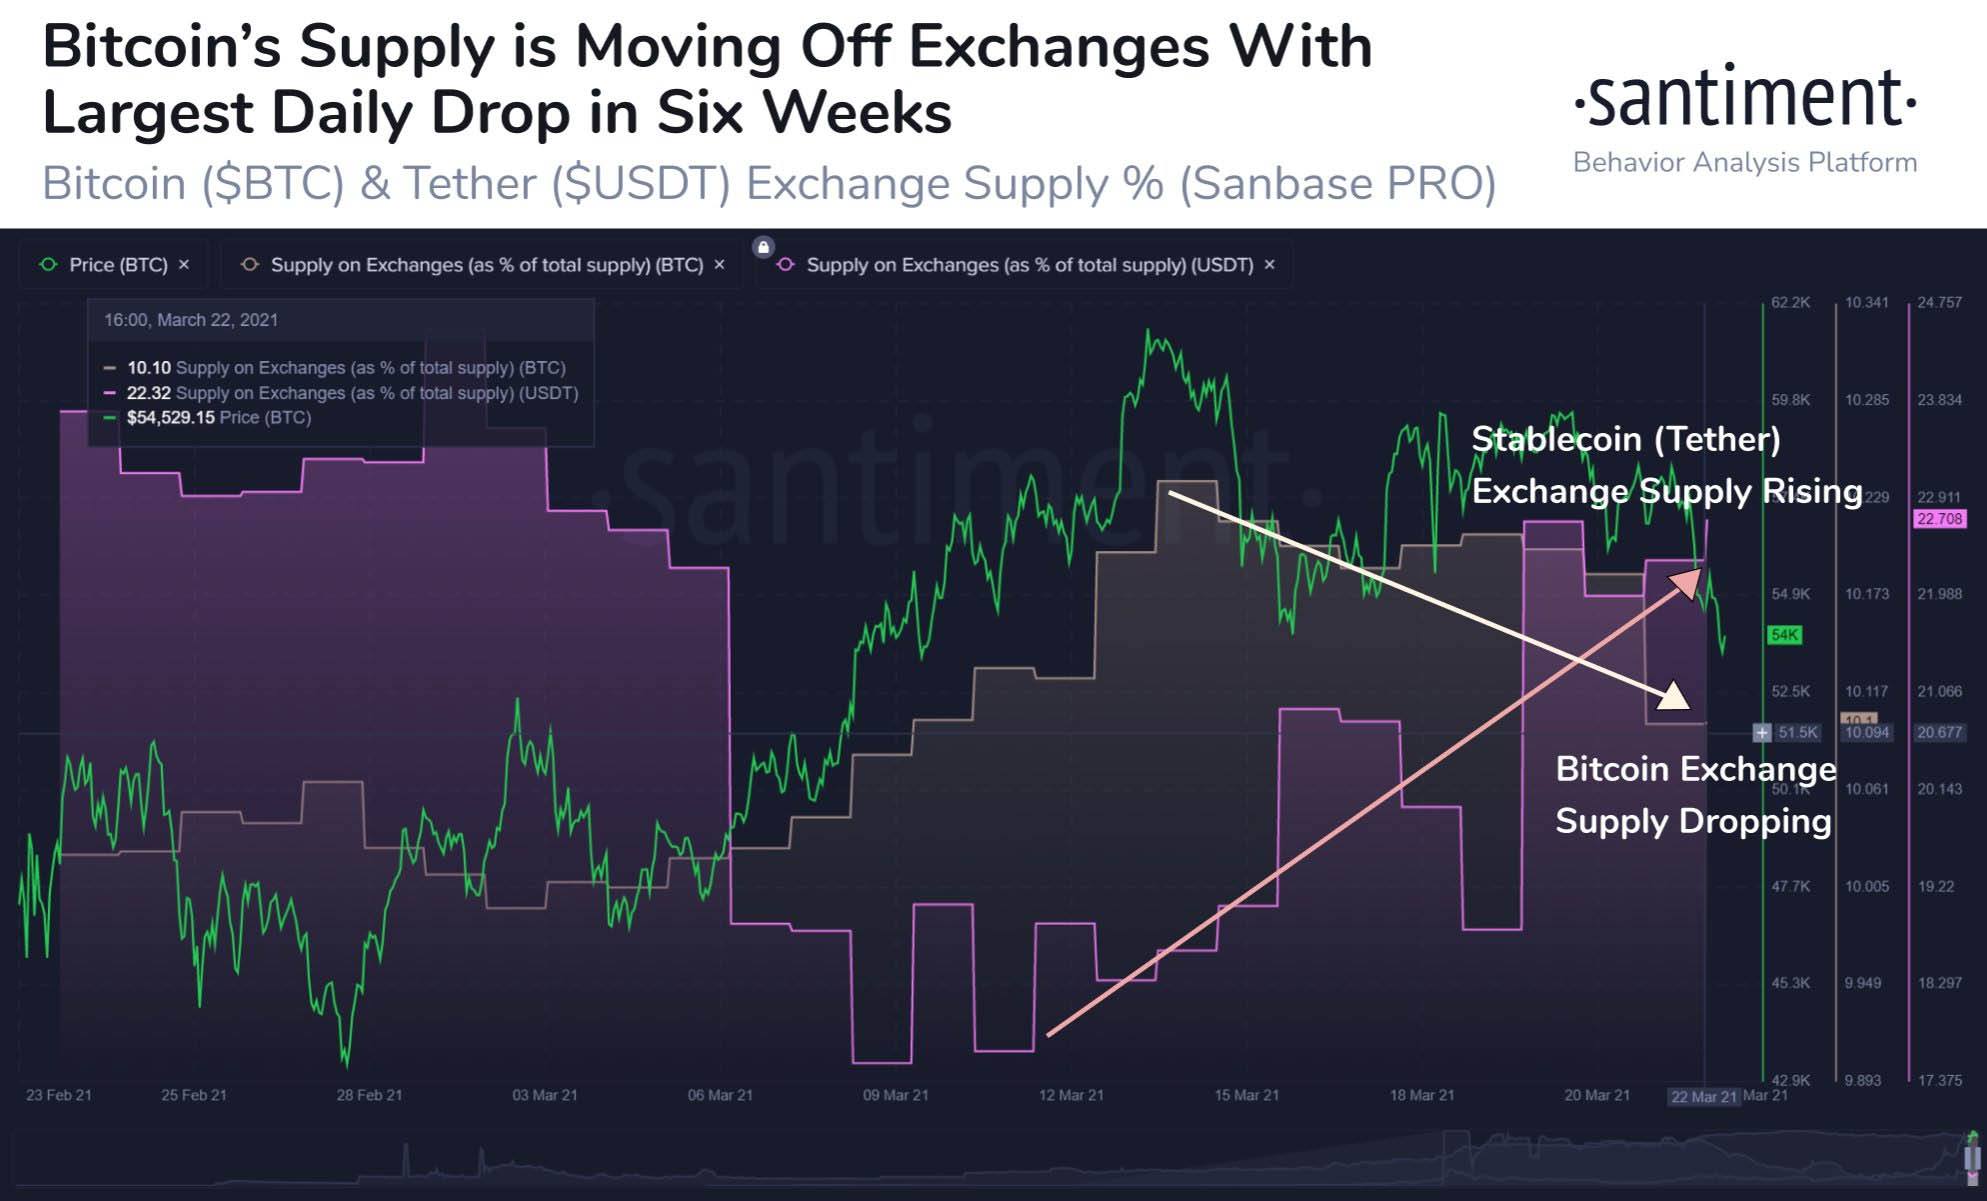
BTC and Tether (USDT) exchange supply changes vs. BTC/USD. Source: Santiment/ Twitter
24-hour liquidations near $2 billion
As Cointelegraph reported, however, other on-chain metrics suggest that Bitcoin could be at least half way through its latest bull run, with only the top formation segment left.
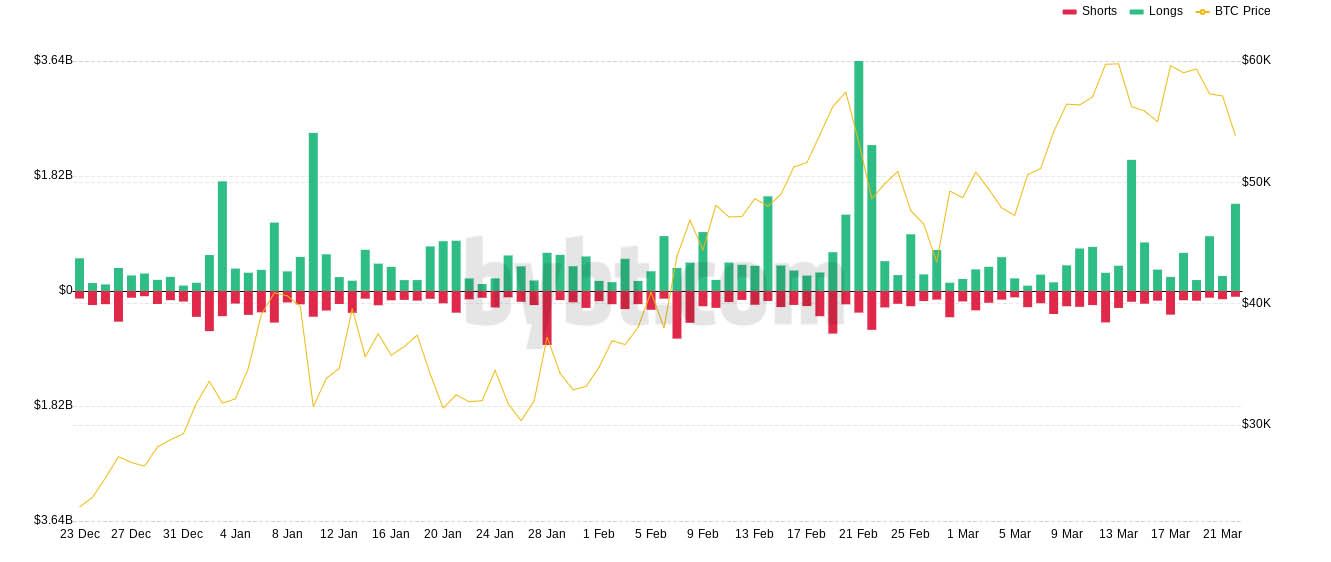
Bitcoin liquidations chart. Source: Bybt
Not every trader was meanwhile prepared for the extent of the overnight drop, as demonstrated by the $1.38 billion in liquidated longs over the past 24 hours out of $1.7 billion in total.
2021 has become notorious for those betting on price direction across cryptocurrencies, with leveraged traders in particular contributing to a huge amount in liquidiations, data from Bybt confirms.
BTC/USD 1-hour candle chart (Bitstamp). Source: Tradingview
Author

Cointelegraph Team
Cointelegraph
We are privileged enough to work with the best and brightest in Bitcoin.