Bitcoin, Ethereum, and Ripple price explodes following positive news
- Bitcoin is up more than 2% in the past few hours, eying up $11,000.
- Ethereum had a more substantial breakout climbing almost 3% towards $355.
- Similarly, XRP is back, attempting to rise above a critical pattern formed on the daily chart.

The entire crypto market jumped $11 billion in market capitalization after Square's announcement, a company founded by Jack Dorsey, CEO of Twitter, to purchase $50 million in Bitcoin.
Bitcoin changes its short-term direction
Following the recent price explosion from Bitcoin, it seems that bulls could change the current downtrend on the daily chart.
BTC/USD daily chart
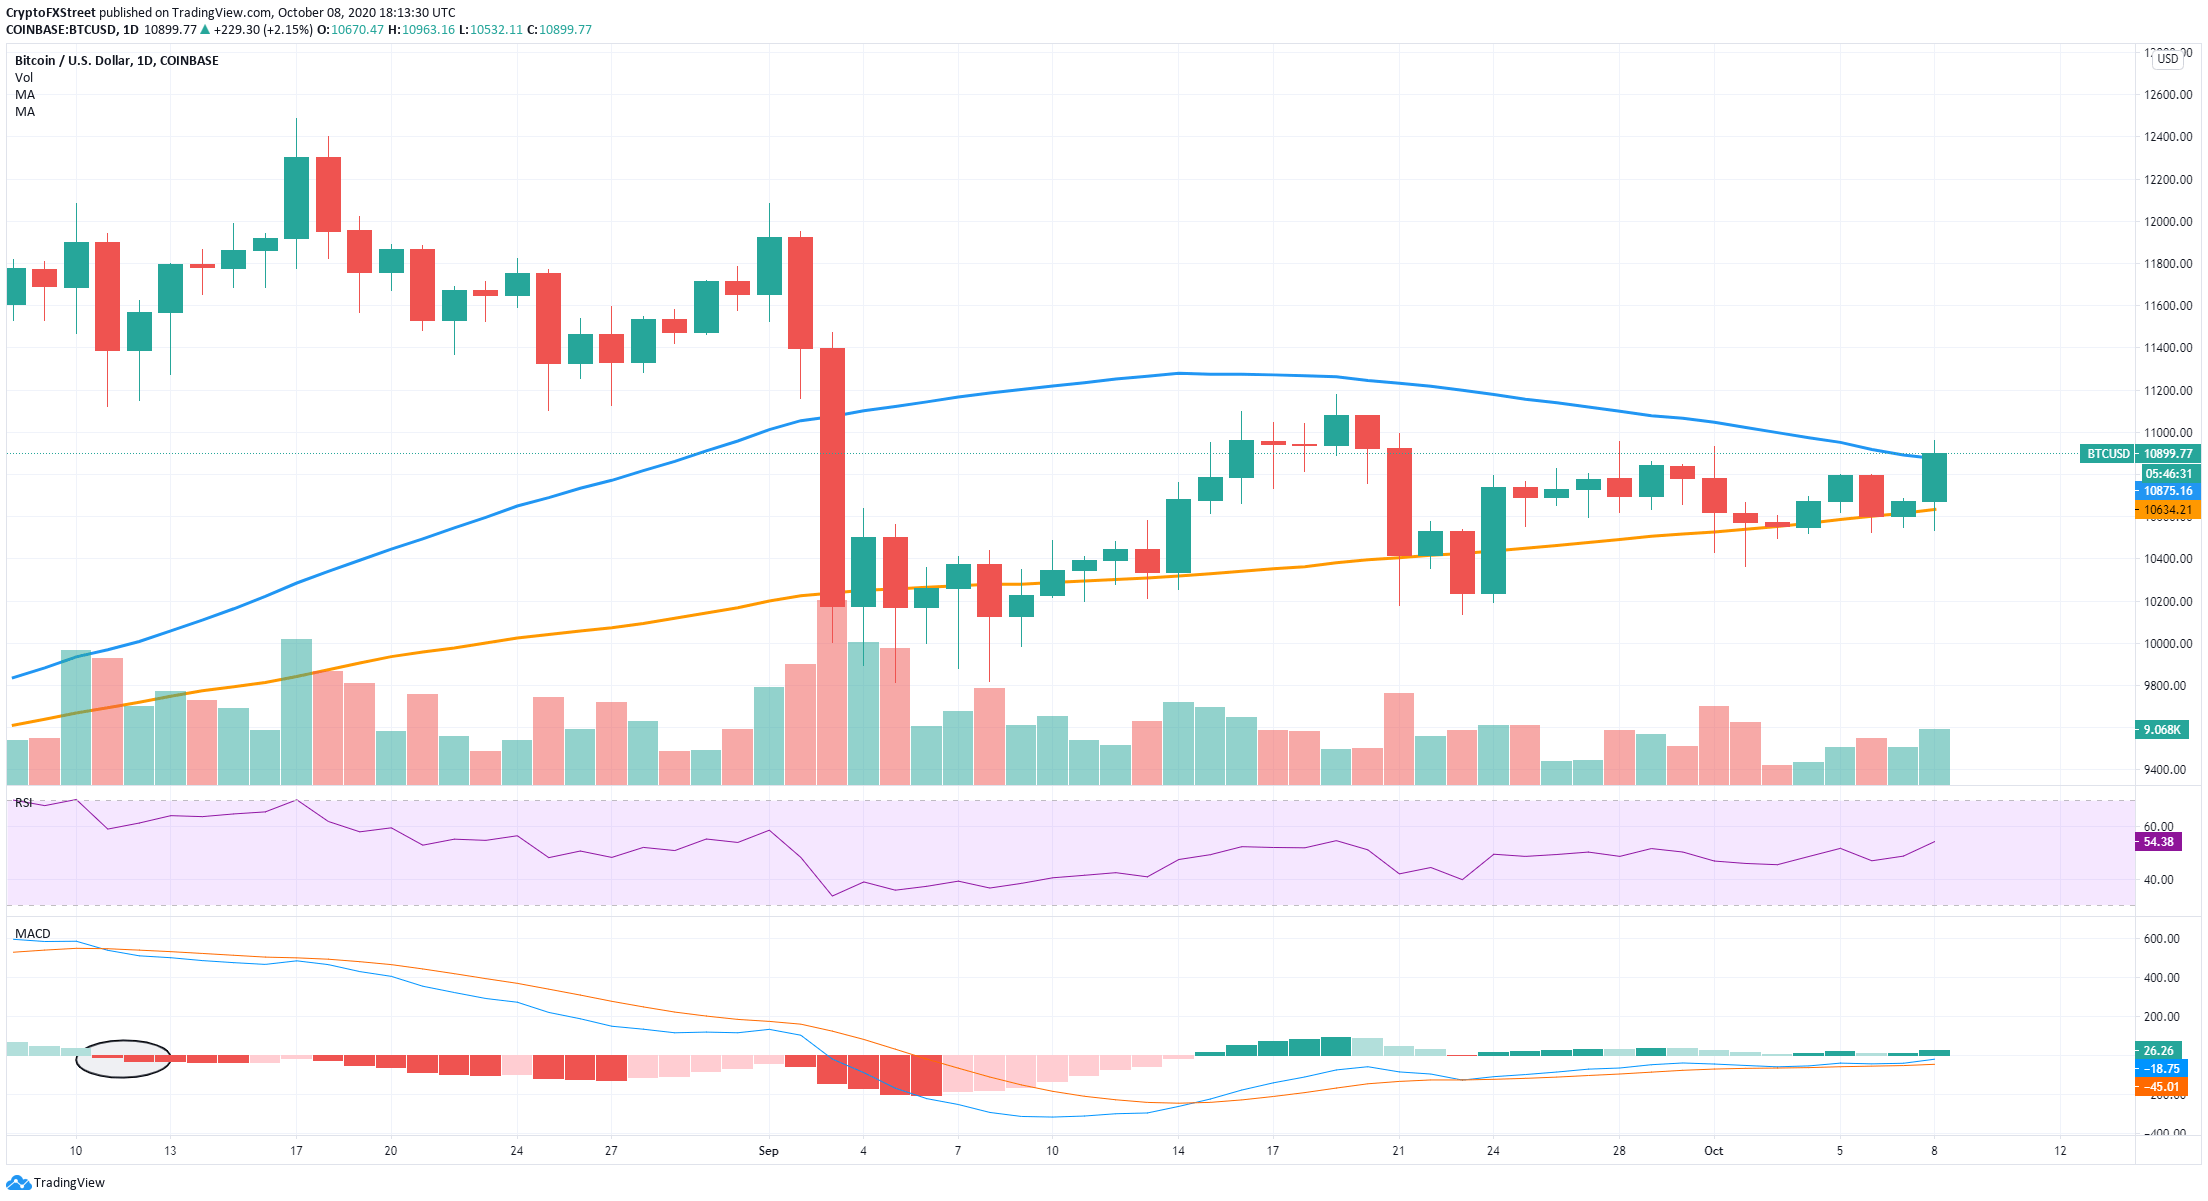
The 100-SMA was kept as a support level, and Bitcoin is currently just above the 50-SMA. If this level can be transformed into a support point, it would be a significant event as it hasn't happened since July.
We can expect the next price target for Bitcoin to be $11,000, followed by $12,000 directly as there are barely any resistance levels on the way up.
Ethereum successfully defends a critical support level
In our latest ETH article, we discussed the possibility of Ethereum not defending the 100-SMA on the daily chart. However, due to the recent market move, the digital asset is now comfortably trading above the 100-SMA.
ETH/USD daily chart
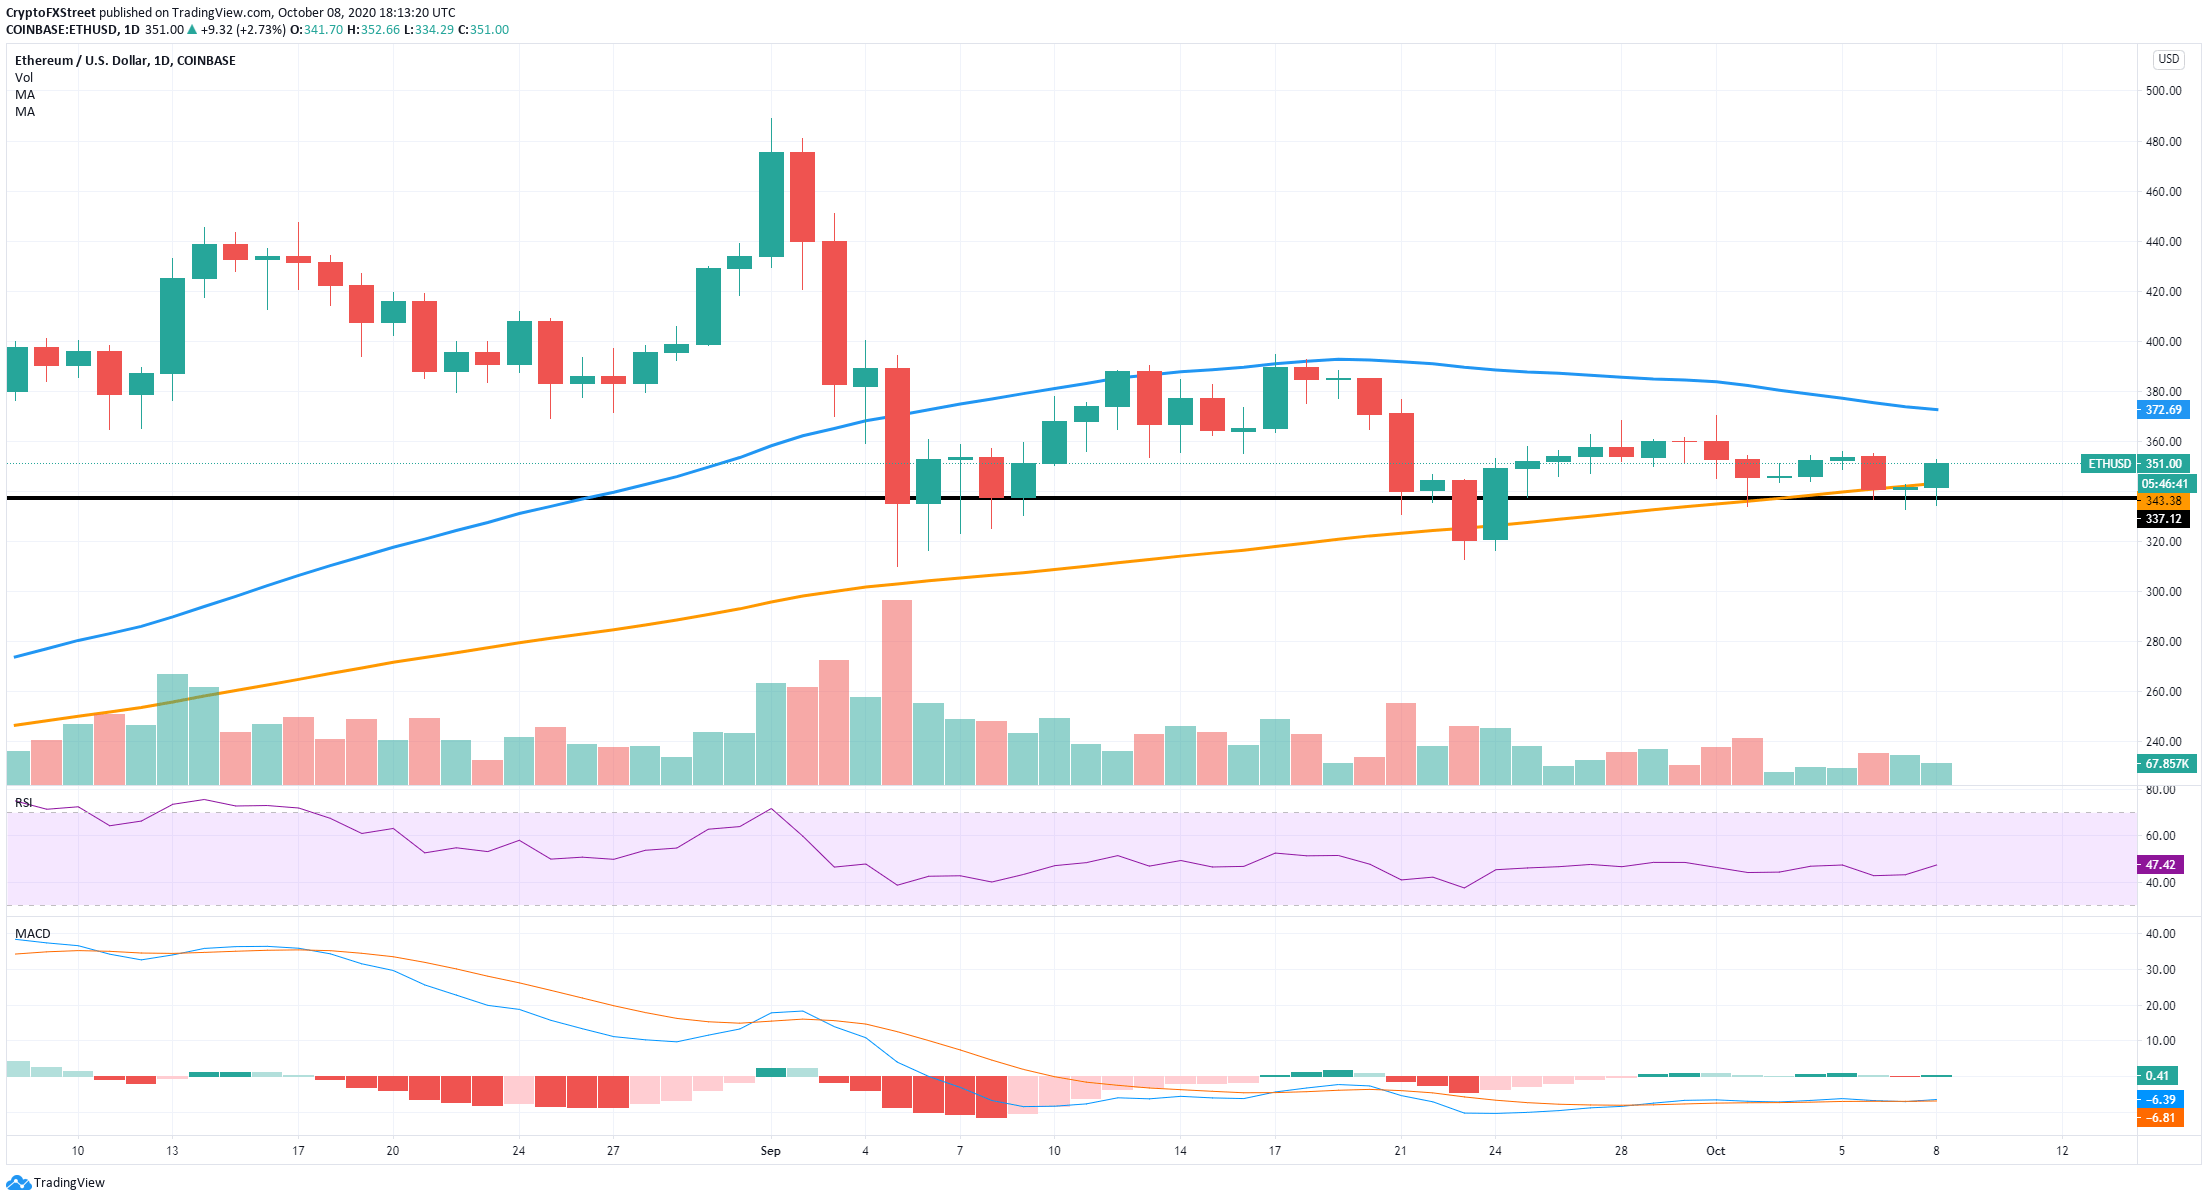
The In/Out of the Money Around Price chart showed steep resistance ahead between $345 and $354; however, the renewed bullish strength was able to push ETH up to $352 already and, most likely, above $354 eventually.
The most critical support level is still the 100-SMA on the daily chart. A rejection into a breakout of this level will drop Ethereum to a maximum low of $270, at the 200-SMA on the daily chart.
XRP attempts to crack the descending parallel channel again
Once again, XRP is at the upper boundary of a descending parallel channel formed on the daily chart.
XRP/USD daily chart
-637377779616131703.png)
Unfortunately, the price was rejected once again from the upper trendline at $0.25. For now, the price has been able to stay above the 100-SMA, which means, bulls can still push the digital asset above the upper boundary and the 50-SMA, which currently coincide.
A breakout above both levels would be massive and likely to take XRP up to $0.30 as there are practically no resistance levels on the way up.
Like we stated in our last XRP technical analysis, a rejection from the upper boundary can potentially drop the price to $0.215.
Author

Lorenzo Stroe
Independent Analyst
Lorenzo is an experienced Technical Analyst and Content Writer who has been working in the cryptocurrency industry since 2012. He also has a passion for trading.



