Binance cuts off $10 billion venture capital arm, BNB price takes 6% loss


  • Binance Labs is now an independent entity after the Venture Capital firm ended its ties with the cryptocurrency exchange. 
  • The venture capital firm has 14x returns on its investments in Web3 and crypto projects.
  • Binance-backed BNB token observed a 6% decline in its price on Friday. 

Binance, one of the largest crypto exchanges by trade volume, has distanced itself from its Venture Capital arm, according to a Bloomberg report published on Friday. The exchange has previously made headlines for its $4.3 billion settlement with the US Department of Justice and for its decision to end support to the Binance-branded stablecoin BUSD. 

BNB price hit a low of $540 on Friday, yielding 6% daily losses for holders. 

Also read: Binance likely to face another lawsuit for violation of US securities laws

Binance exchange and VC arm sever ties

Crypto exchange Binance has noted several changes since the exchange settled charges brought against it by the US Department of Justice (DOJ). Binance’s newly independent venture capital arm has a portfolio worth over $10 billion and covers more than 250 Web3 and crypto projects.

The VC firm’s return on investment is 14x, according to an official blog post by Binance Labs on March 12. Bloomberg’s report reveals that the exchange quietly separated from the VC arm. 

The exchange is now a separate entity, so the spinoff has hit the price of Binance-backed native token BNB

BNB price sees 6% decline on the day

Binance exchange’s native token BNB wiped out gains from early this week and there is a likelihood of further correction to $480 before the token attempts a recovery. In its uptrend, BNB price created several imbalances, the ranges of which are yet to be filled. In its correction, BNB could find support at $500 and $480, within two Fair Value Gaps (FVGs) as seen on the daily price chart. 

BNB price could revisit the Range High at $633.50 if there is sustained buying pressure from traders. 

The Relative Strength Index (RSI) is at 70.71, meaning that BNB is currently at overbought or overvalued levels. This supports the thesis that BNB price could fall further. 

BNB

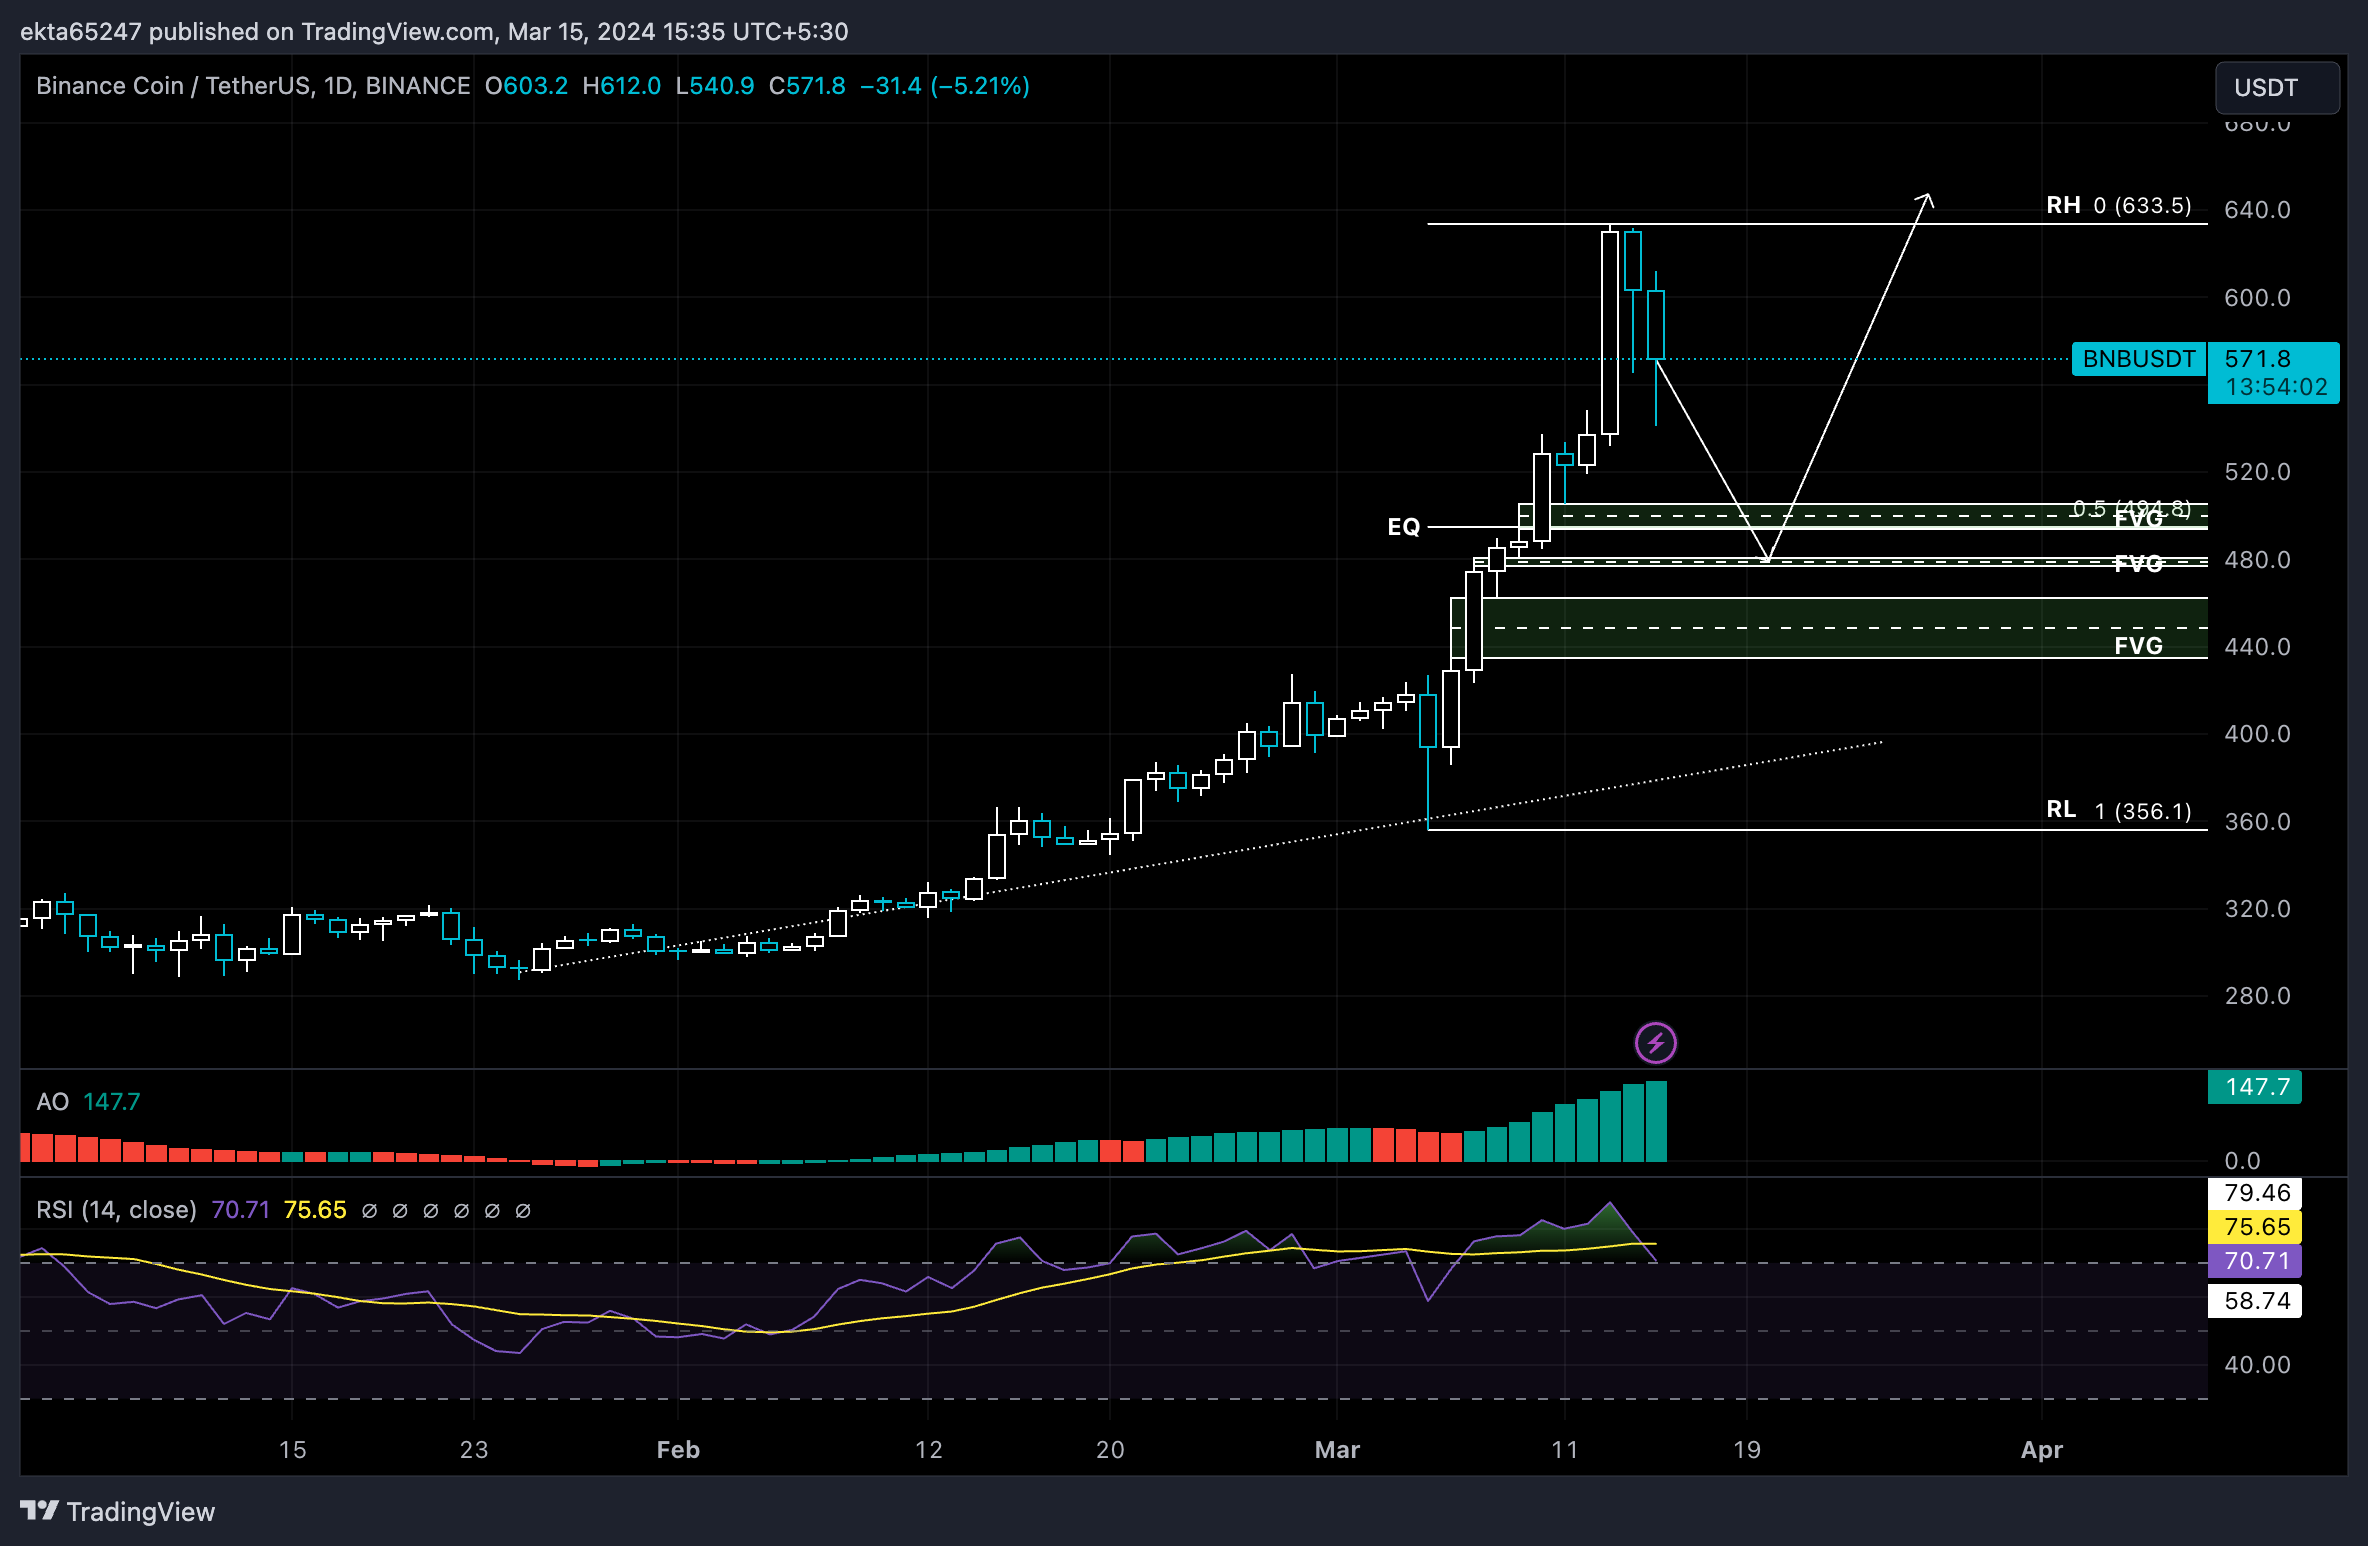
BNB/USDT 1-day chart 

However, a daily candlestick close above $600 could invalidate the bearish thesis and BNB could continue its climb towards the Range High at $633.50. 


Information on these pages contains forward-looking statements that involve risks and uncertainties. Markets and instruments profiled on this page are for informational purposes only and should not in any way come across as a recommendation to buy or sell in these assets. You should do your own thorough research before making any investment decisions. FXStreet does not in any way guarantee that this information is free from mistakes, errors, or material misstatements. It also does not guarantee that this information is of a timely nature. Investing in Open Markets involves a great deal of risk, including the loss of all or a portion of your investment, as well as emotional distress. All risks, losses and costs associated with investing, including total loss of principal, are your responsibility. The views and opinions expressed in this article are those of the authors and do not necessarily reflect the official policy or position of FXStreet nor its advertisers. The author will not be held responsible for information that is found at the end of links posted on this page.

If not otherwise explicitly mentioned in the body of the article, at the time of writing, the author has no position in any stock mentioned in this article and no business relationship with any company mentioned. The author has not received compensation for writing this article, other than from FXStreet.

FXStreet and the author do not provide personalized recommendations. The author makes no representations as to the accuracy, completeness, or suitability of this information. FXStreet and the author will not be liable for any errors, omissions or any losses, injuries or damages arising from this information and its display or use. Errors and omissions excepted.

The author and FXStreet are not registered investment advisors and nothing in this article is intended to be investment advice.

Join Telegram

Recommended content


Recommended Content

Editors’ Picks

Could Worldcoin price shoot up 45% ahead of OpenAI’s live stream on Monday?

Could Worldcoin price shoot up 45% ahead of OpenAI’s live stream on Monday?

Worldcoin has formed a double bottom around a key support level, suggesting a potential accumulation. If the OpenAI’s Monday live stream has a positive impact on Artificial Intelligence field, it could positively impact WLD and other AI-based tokens. 

More Worldcoin News

Here’s what needs to happen for The Graph price to revisit $0.422

Here’s what needs to happen for The Graph price to revisit $0.422

The Graph price trades inside the $0.192 to $0.494 range. Investors need to wait for GRT to overcome $0.343 before being bullish on GRT. If successful, GRT could rally 50% and revisit the $0.422 hurdle. A decisive daily candlestick close below $0.192 will invalidate the bullish thesis.

More The Graph News

SingularityNET price could bounce 30% if AGIX can hold this level

SingularityNET price could bounce 30% if AGIX can hold this level

SingularityNET price has been consolidating around the bottom of the $0.903 to $1.475 range for nearly a month. With some AI-tokens showing signs of revival, AGIX needs to be enalyzed for potential breakout opportunities like Arkham (ARKM).

More SingularityNET News

Arkham price primed for a recovery rally ahead of OpenAI’s announcement

Arkham price primed for a recovery rally ahead of OpenAI’s announcement

Arkham price eyes a potential reversal as it clears key hurdles. ARKM likely to rally 27% if it can overcome $2.74 resistance level. A breakdown of $2.28 wil invalidate the bullish thesis for the AI-based token.

More Arkham News

Bitcoin: Why BTC is close to a bottom

Bitcoin: Why BTC is close to a bottom

Bitcoin (BTC) price efforts of a recovery this week have been countered by selling pressure during the onset of the American session. However, the downside potential appears to have been capped. Markets have noted significant trading differences between sessions, and while the Asian market showed strength, whatever ground they were able to cover was oftentimes wiped out by traders in the US.

Read full analysis

BTC

ETH

XRP