AVAX price set sights on new all-time highs as bullish formation emerges
- AVAX price is in the process of forming a bullish chart pattern, suggesting a new record high for the token.
- If Avalanche manages to slice above $123, a 41% rally would then be on the radar.
- AVAX bulls are eyeing their next target at $174.

AVAX price is currently forming a bullish chart pattern that could set a new record high for Avalanche at $174. The token must overcome a series of challenges ahead, including the toughest hurdle at $123, in order for the optimistic outlook to be validated.
AVAX price awaits 41% ascent
AVAX price is producing an inverse head-and-shoulders pattern on the 12-hour chart, suggesting a massively bullish forecast for the token.
However, investors should note that the optimistic target of a 41% rally toward $174 will only be on the radar if Avalanche manages to slice above the neckline of the governing technical pattern at $123.
AVAX price is in the process of forming the right shoulder of the prevailing chart pattern. An increase in buying pressure may see Avalanche reach the neckline, but not without tackling a few hurdles ahead first.
The first line of resistance for AVAX price is at the 50 twelve-hour Simple Moving Average (SMA) at $101, then at the 100 twelve-hour SMA at $105. The 61.8% Fibonacci retracement level will then act as an additional obstacle for Avalanche at $106.
Before approaching the neckline of the inverse head-and-shoulders pattern, AVAX price will also face a headwind at $115, where the 21 twelve-hour SMA and 78.6% Fibonacci retracement level intersect.
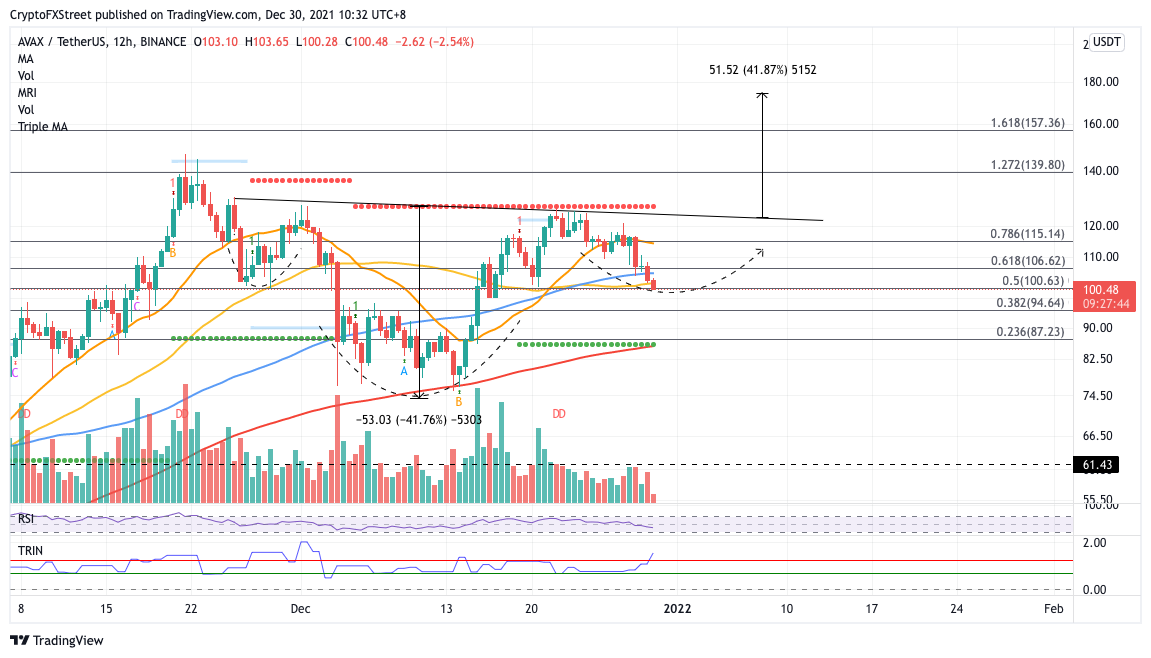
AVAX/USDT 12-hour chart
AVAX price will face another challenge at the neckline of the governing technical pattern at $123, coinciding with the resistance line given by the Momentum Reversal Indicator (MRI) before the 41% rally is put on the radar.
However, if selling pressure increases, AVAX price will discover immediate support at the 50% retracement level at $100. The following lines of defense are at the 38.2% Fibonacci retracement level at $94, then at the 23.6% Fibonacci retracement level at $87, coinciding with the 200 twelve-hour SMA and support line given by the MRI.
Author

Sarah Tran
Independent Analyst
Sarah has closely followed the growth of blockchain technology and its adoption since 2016.


