Top 3 Price Prediction Bitcoin, Ethereum, Ripple: BTC, ETH and XRP show signs of short-term correction
- Bitcoin price edges slightly down on Wednesday after hitting a new all-time high of $108,353 the previous day.
- Ethereum price faces rejection from the $4,000 level, hinting at a correction in the short term.
- Ripple price trades slightly down after retesting its $2.66 level, suggesting a pullback on the cards.

Bitcoin (BTC) price edges slightly down during the Asian session on Wednesday. Ethereum (ETH) and Ripple (XRP) followed BTC’s footsteps and declined slightly; all coins’ technical indicators and price action suggest a possible short-term correction on the cards.
Bitcoin bulls show signs of exhaustion
Bitcoin price reached a new all-time high of $108,353 on Tuesday after rallying 3.32% in the previous week. At the time of writing on Wednesday, it trades slightly down around $105,019.
If BTC faces a correction and closes below the $101,109 support level, it would extend the decline to retest its next support level at $90,000.
The Relative Strength Index (RSI) on the daily chart reads 66 after rejecting the overbought level of 70 on Tuesday and points downwards, indicating a decrease in bullish momentum. If the RSI continues to edge down and close below its neutral level of 50, the price of Bitcoin will fall sharply.
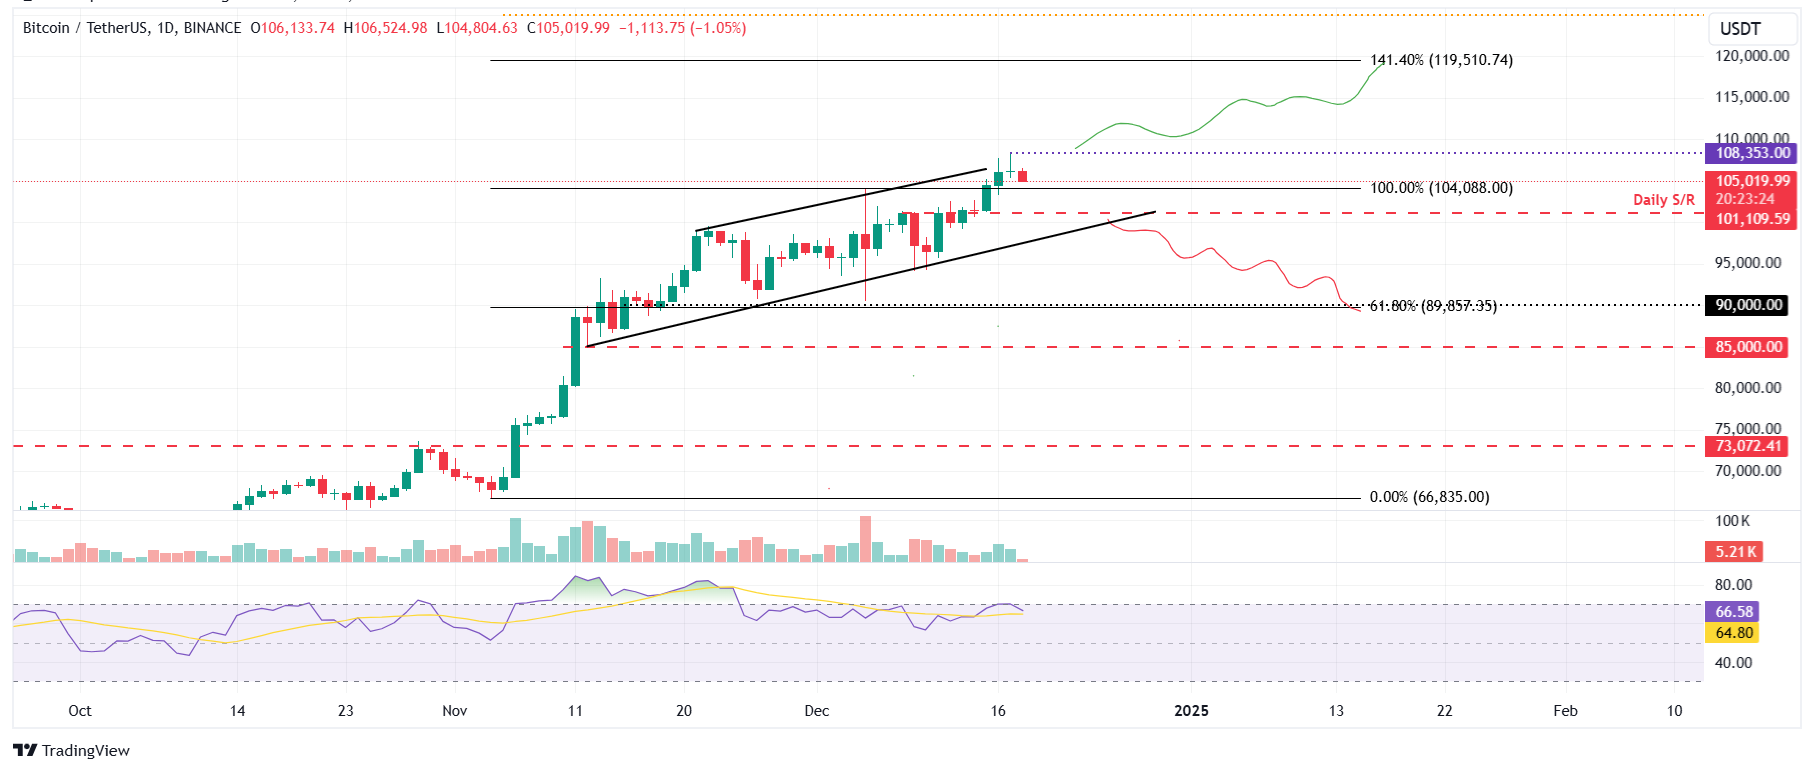
BTC/USDT daily chart
However, if Bitcoin continues its upward trend and closes above its ATH of $108,353, it would extend the rally to test a new ATH of $119,510. This level aligns with the 141.4% Fibonacci extension drawn from the November 4 low of $66,835 to the December 5 high of $104,088.
Ethereum price is set for a downturn as it faces rejection around $4,000
Ethereum price faced rejection around the $4,000 level on Monday and declined 2.34% the next day. At the time of writing on Wednesday, it continues to trade down around $3,858.
If the $4,000 level continues as resistance, ETH will extend the pullback to retest its weekly support at $3,522.
The RSI on the daily chart reads 57, pointing downwards towards its neutral level of 50, indicating early signs of bearish momentum. If the RSI closes below 50 on a daily basis, Ethereum’s price would fall sharply.
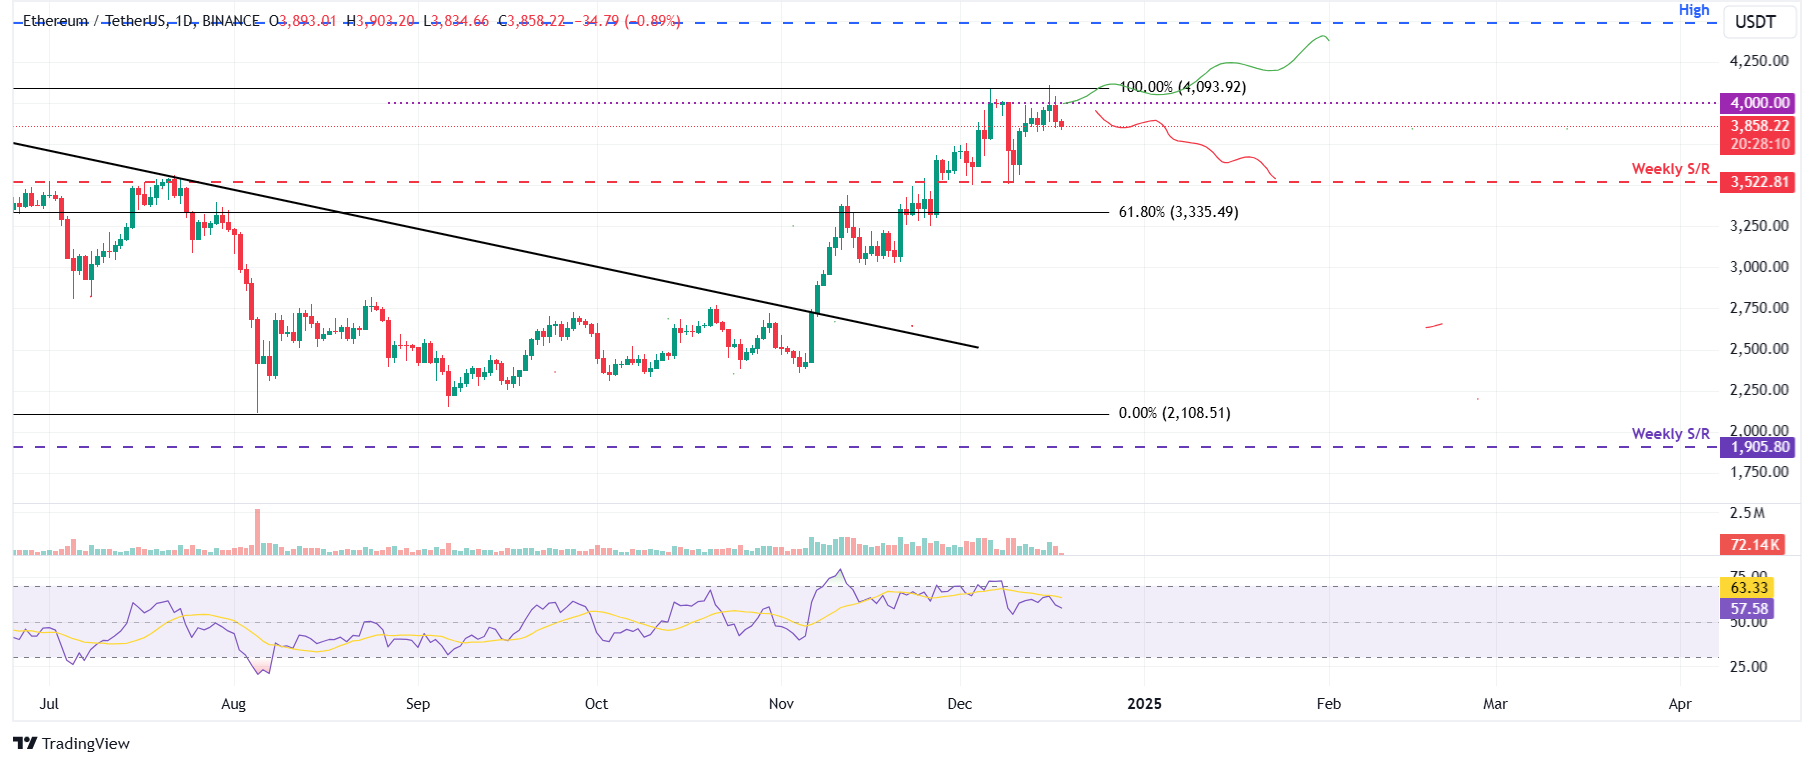
ETH/USDT daily chart
If ETH breaks and closes above the $4,000 level, it could extend the rally by 12% to retest its December 9, 2021, high of $4,488.
Ripple shows signs of indecisiveness
Ripple price found support around the $1.96 level on December 10, rallied 16% until Tuesday, and faced slight rejection around the $2.66 level. At the time of writing on Wednesday, it trades slightly down around $2.53.
If the $2.66 level continues as resistance, XRP could extend the decline to retest its next support level at $2.21.
The RSI on the daily chart reads 65 after rejecting the overbought level of 70, suggesting indecisiveness among the traders.
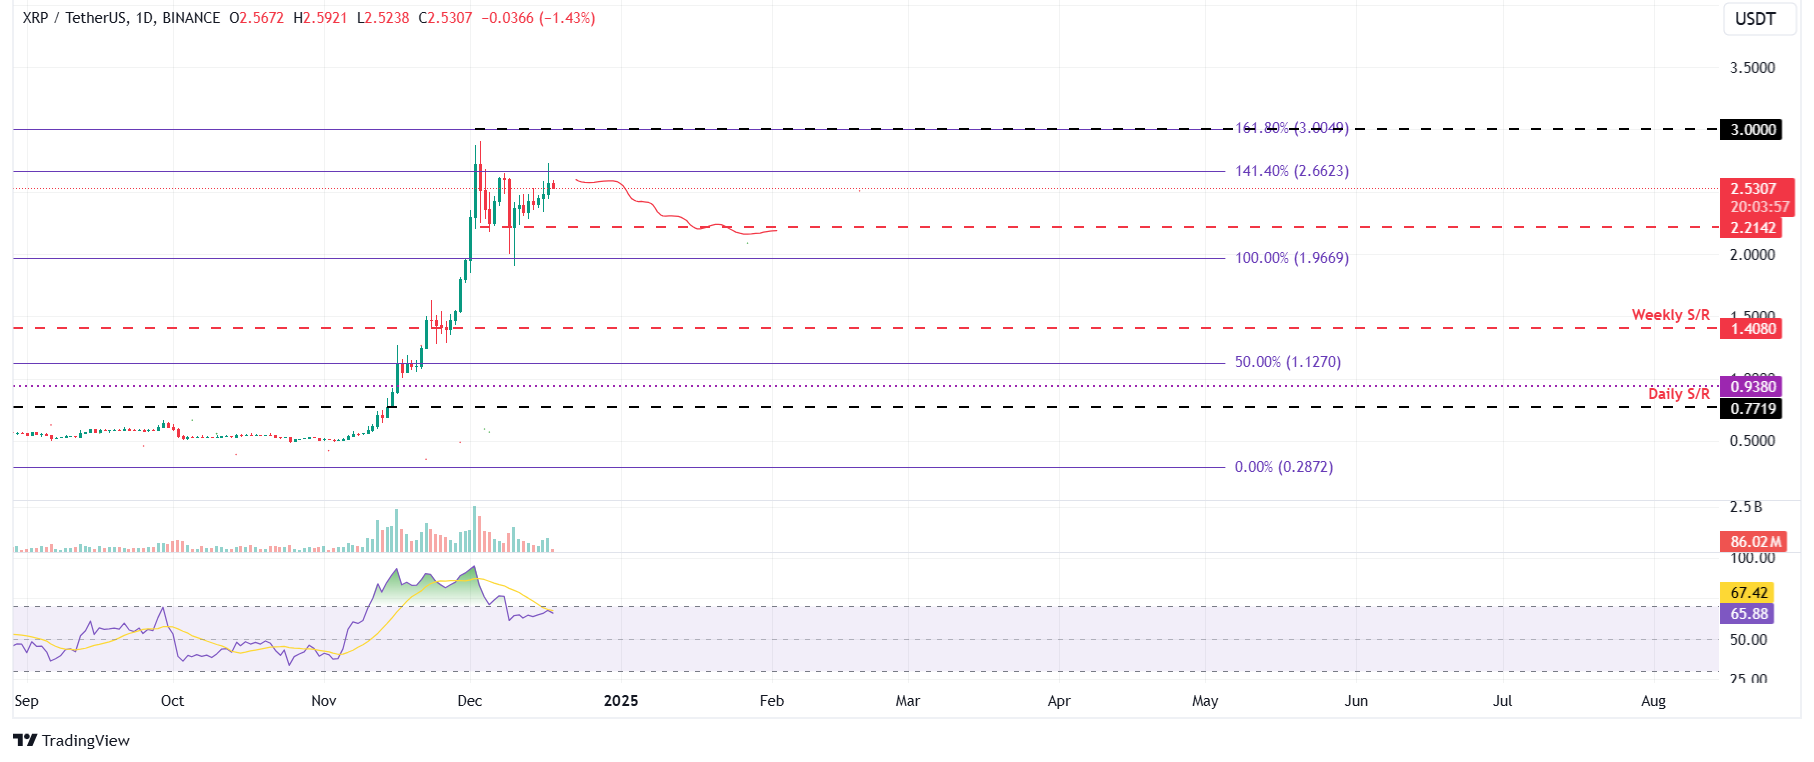
XRP/USDT daily chart
If XRP continues to rise and closes above $2.66, it could extend the rally to retest the psychologically important level of $3.00.
Bitcoin, altcoins, stablecoins FAQs
Bitcoin is the largest cryptocurrency by market capitalization, a virtual currency designed to serve as money. This form of payment cannot be controlled by any one person, group, or entity, which eliminates the need for third-party participation during financial transactions.
Altcoins are any cryptocurrency apart from Bitcoin, but some also regard Ethereum as a non-altcoin because it is from these two cryptocurrencies that forking happens. If this is true, then Litecoin is the first altcoin, forked from the Bitcoin protocol and, therefore, an “improved” version of it.
Stablecoins are cryptocurrencies designed to have a stable price, with their value backed by a reserve of the asset it represents. To achieve this, the value of any one stablecoin is pegged to a commodity or financial instrument, such as the US Dollar (USD), with its supply regulated by an algorithm or demand. The main goal of stablecoins is to provide an on/off-ramp for investors willing to trade and invest in cryptocurrencies. Stablecoins also allow investors to store value since cryptocurrencies, in general, are subject to volatility.
Bitcoin dominance is the ratio of Bitcoin's market capitalization to the total market capitalization of all cryptocurrencies combined. It provides a clear picture of Bitcoin’s interest among investors. A high BTC dominance typically happens before and during a bull run, in which investors resort to investing in relatively stable and high market capitalization cryptocurrency like Bitcoin. A drop in BTC dominance usually means that investors are moving their capital and/or profits to altcoins in a quest for higher returns, which usually triggers an explosion of altcoin rallies.
Author

Manish Chhetri
FXStreet
Manish Chhetri is a crypto specialist with over four years of experience in the cryptocurrency industry.


