Algorand price sets for a rally following descending trendline breakout
- Algorand price breaks above the descending trendline, suggesting a bullish move ahead.
- Side-lined buyers can accumulate ALGO around the $0.1382 level.
- A daily candlestick close below $0.1234 would invalidate the bullish thesis.

Algorand (ALGO) price broke above the descending trendline on Saturday and surged 9.85% in the subsequent two days. Sideline buyers may consider accumulating ALGO around the $0.1382 level before potential further rallies in the coming days.
Algorand price shows potential for a rally
Algorand broke above its descending trendline on Saturday, triggering a 9.85% rally over the following two days. As of Tuesday, it is trading 1% higher at $0.1593. Following this significant move, ALGO bulls may pause, potentially prompting a retracement that could present a favorable buying opportunity for sidelined investors. Those seeking entry points could consider purchasing near the trendline support level of around $0.1382.
Assuming Algorand's price bounces off the $0.1382 level, it could rally 14% to retest its weekly resistance of $0.1588.
The Relative Strength Index (RSI) and Awesome Oscillator (AO) indicators on the daily chart support the bounce above, which are firmly present above their respective mean values of 50 and 0. The momentum indicators clearly signal that bullish momentum is in control.
If ALGO closes above the weekly resistance at $0.1588, it could rally 22% to retest its high of $0.1933 on June 7.
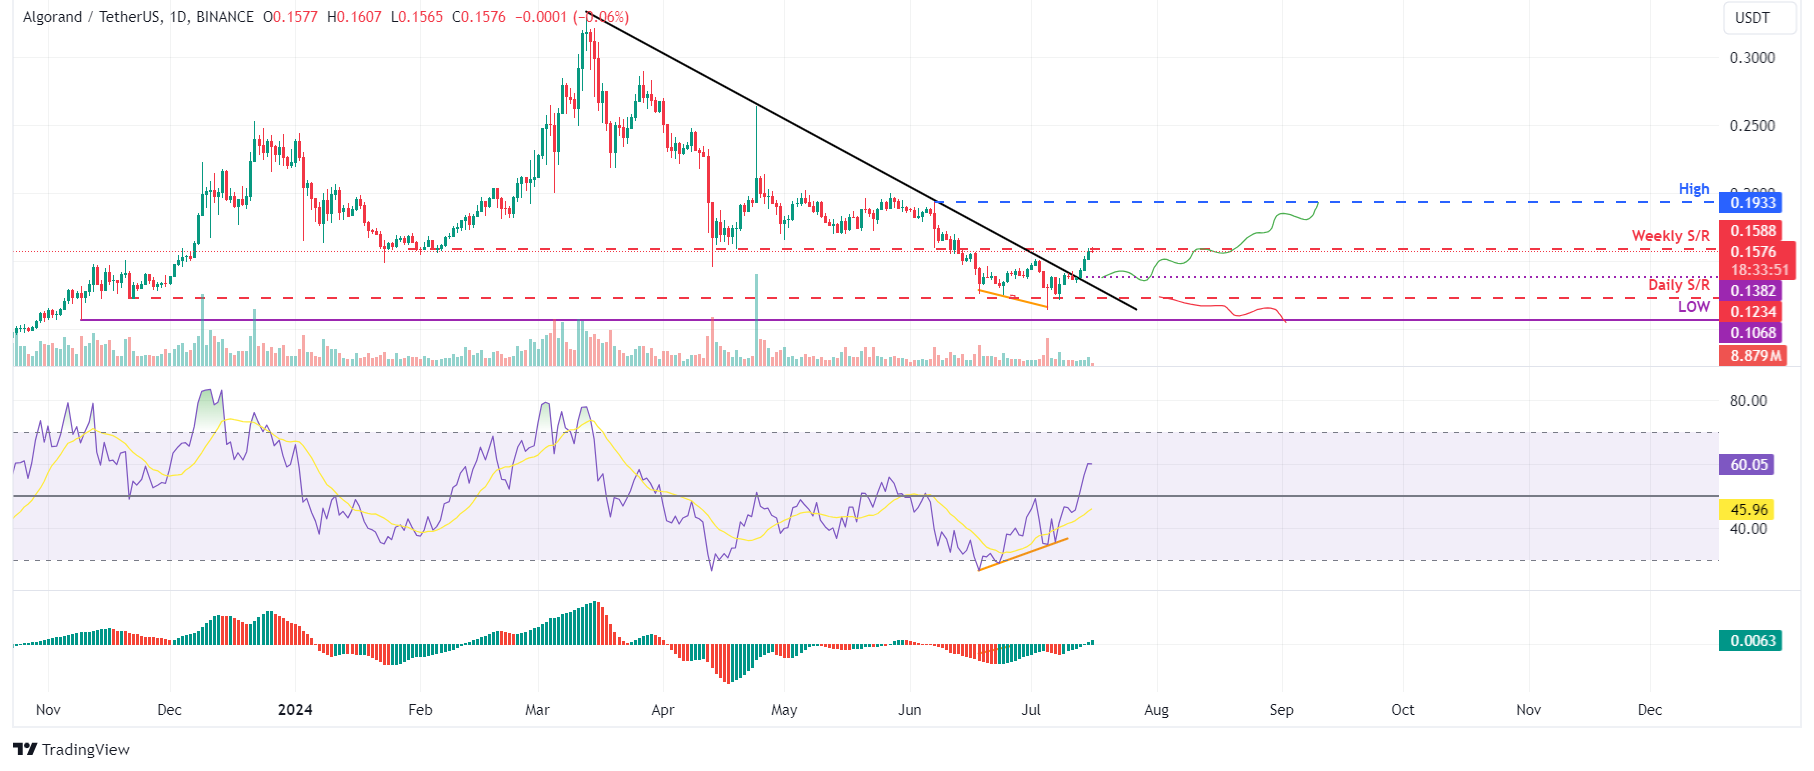
ALGO/USDT daily chart
Despite the bullish outlook pictured by technical analysis, if Algorand's price posts a daily candlestick close below $0.1234, it will form a lower low. This scenario would signal a bearish outlook, possibly leading to a price fall of around 13% to the November 9, 2023, low of $0.1068.
Author

Manish Chhetri
FXStreet
Manish Chhetri is a crypto specialist with over four years of experience in the cryptocurrency industry.


