|

Algorand price has traders trailing up stops as the bulls have breached the first target

  • Algorand price have risen 25% this week.
  • ALGO price has a strong Fibonacci level 5% above the current price.
  • A break, retest, and surge above $0.93 will invalidate the neutral thesis.

Algorand price should have investors cautiously watching the digital asset as the first target has already been breached. 

Algorand price says "give it more time"

Algorand price is trading at $0.89, 25% above the breakout level. It was mentioned in Monday's thesis that the wedging-like pattern could potentially break upwards and estimate a price projection of 25%. 

Traders who missed the move should consider waiting for more price action to unfold as a Fibonacci retracement tool has the 1.618 level 5% above the current price. 

Algorand price should also warrant traders to trail their stops as the 1.618 level may never get touched since it is likely many pattern traders have issued automated sell orders into the wedge's $0.89 target.

Market conditions could project further upside for ALGO price. The bulls would have to break above and retest the 1.618 Fib level at $0.93 with a more significant uptick in volume. The next target for the bulls would be the 2 and 2.618 Fibonacci levels at $0.98 and $1.06, representing a 20% increase from the current price.
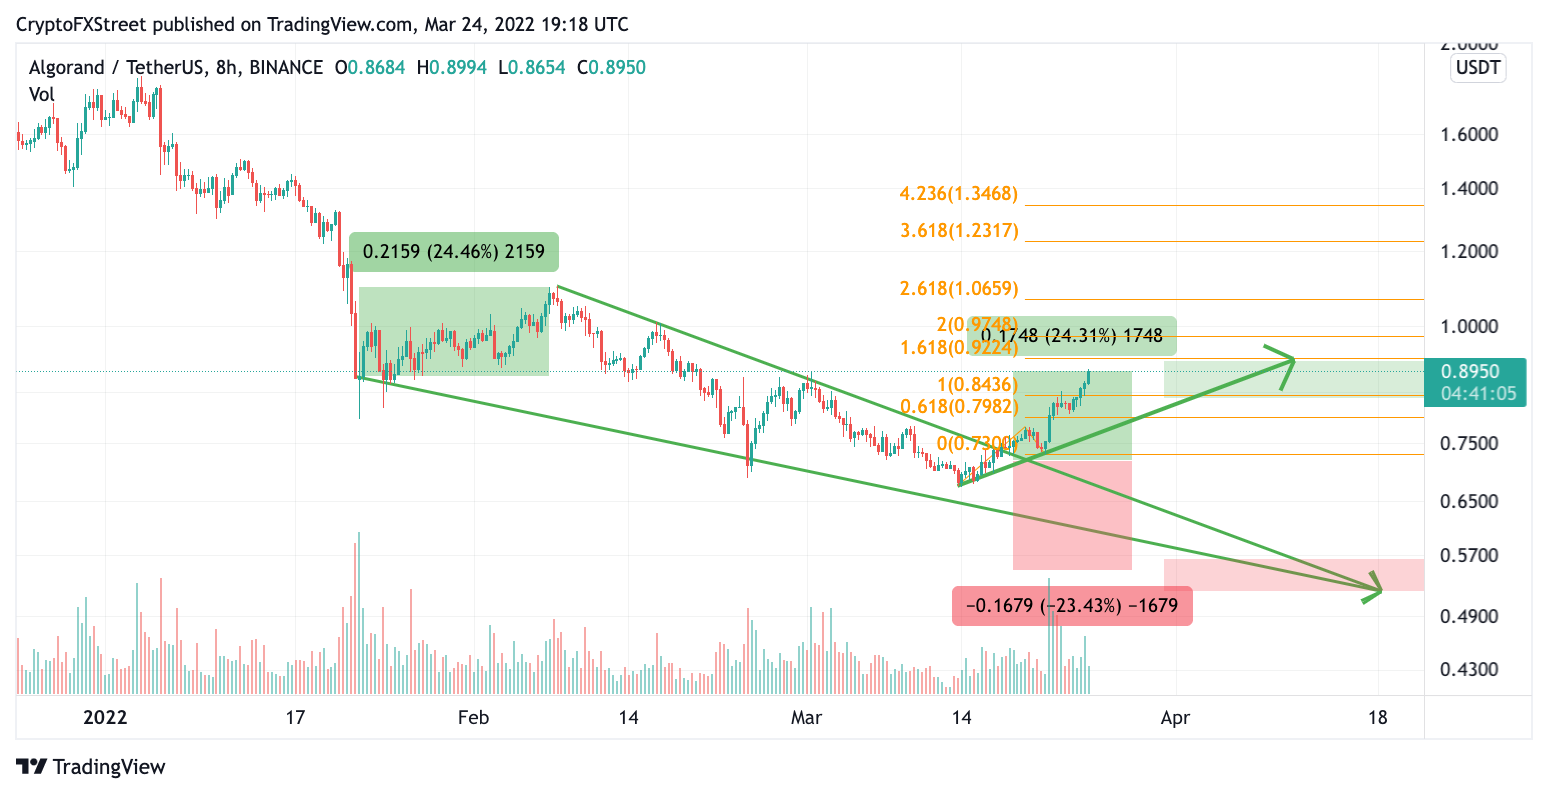
ALGO/USDT 8-Hr Chart

It is also worth noting that the volume pattern decreases as the ALGO price rallies, which could be early evidence of weakness in the trend. Ultimately, a break below the green ascending trend line at $0.70 could invalidate the bullish momentum and send prices back into $0.73 and $0.70.

Author

FXStreet Team

Composed of a group of economic journalists and FX experts, the FXStreet content team produces and oversees all content published on FXStreet. It provides a purely journalistic approach to the Forex market.


More from FXStreet Team
Share:

Editor's Picks

Bitcoin Weekly Forecast: BTC retreats as macro headwinds grow
Bitcoin (BTC) remains under pressure, down over 4% this week and trading around $76,900 at the time of writing on Friday. Institutional demand shows signs of weakness as spot BTC Exchange Traded Funds (ETFs) are on track to end their three-week inflow streak, recording nearly $500 million in net outflows through Thursday.
XRP falls toward key support as macro uncertainty, weak momentum cap recovery
Ripple (XRP) falls below $1.33 on Friday, marking the third consecutive day of declines. The token continues to track the broader cryptocurrency market downturn, with investors closely monitoring heightened macroeconomic uncertainty ahead of the United States (US) Consumer Price Index (CPI) release and next week’s Federal Reserve (Fed) monetary policy decision.
Crypto Today: Bitcoin, Ethereum, XRP stabilize at lower levels amid ETF outflows and macroeconomic risks
The broader cryptocurrency market is rising on Friday, with Bitcoin (BTC) trading above $77,000 after testing lower support near $76,500. Ethereum (ETH) shows signs of stability, hovering above the support provided at $2,400 despite capped upside at $2,500. Meanwhile, Ripple (XRP) holds above $1.33 after three straight days of declines, reflecting growing headwinds due to macroeconomic uncertainty.
Bitcoin pulls back as another golden cross fails to deliver
Earlier this week, Bitcoin formed a golden cross, a technical signal that occurs when the price’s 50-day moving average rises above the 200-day moving average and is conventionally viewed as a precursor to a bullish rally. Historically, however, that’s often not been the case.
Bitcoin: BTC retreats as macro headwinds grow
Bitcoin (BTC) remains under pressure, down over 4% this week and trading around $76,900 at the time of writing on Friday. Institutional demand shows signs of weakness as spot BTC Exchange Traded Funds (ETFs) are on track to end their three-week inflow streak, recording nearly $500 million in net outflows through Thursday.

