A bullish case on why Polkadot price could revisit $30
- Polkadot price slides lower in search of stable support levels to trigger an uptrend.
- Overcoming the $21.08 to $23.06 breaker will open the path for DOT to reach $30.50.
- A daily candlestick close below $15.83 will invalidate the bullish thesis.

Polkadot price is sliding toward the lower end of its two-month consolidation range. However, this is an opportunity that sidelined buyers should not miss, as good things await DOT in the near future.
Polkadot price faces an uphill battle
Polkadot price rallied 47% to set a swing low at $15.83 on January 24 and a swing high at $23.19. This move set a range that DOT buyers and sellers have respected for over two months.
Although on April 2, Polkadot price tried to escape from this range by moving above the range high at $23.19, it failed. As a result, DOT produces a daily candlestick close below it, suggesting a lack of buying pressure. After the failure, there was a sell-off that led to a 20% to where the altcoin currently trades – $18.08.
This downswing did more than just push DOT lower, it flipped the $21.08 to $23.06 demand zone created on March 31 into a bearish breaker. This technical formation forecasts that a retest after a down move is often rejected violently.
Hence, investors need to exercise caution and prevent from opening fresh long positions. A daily candlestick close above $23.06 would be the best place to expect more gains. Assuming bulls manage to push the altcoin above the said breaker, it will trigger a run-up that will allow DOT a free range up to $30.50. So, the total run-up for DOT from the current position would constitute a 70% ascent.
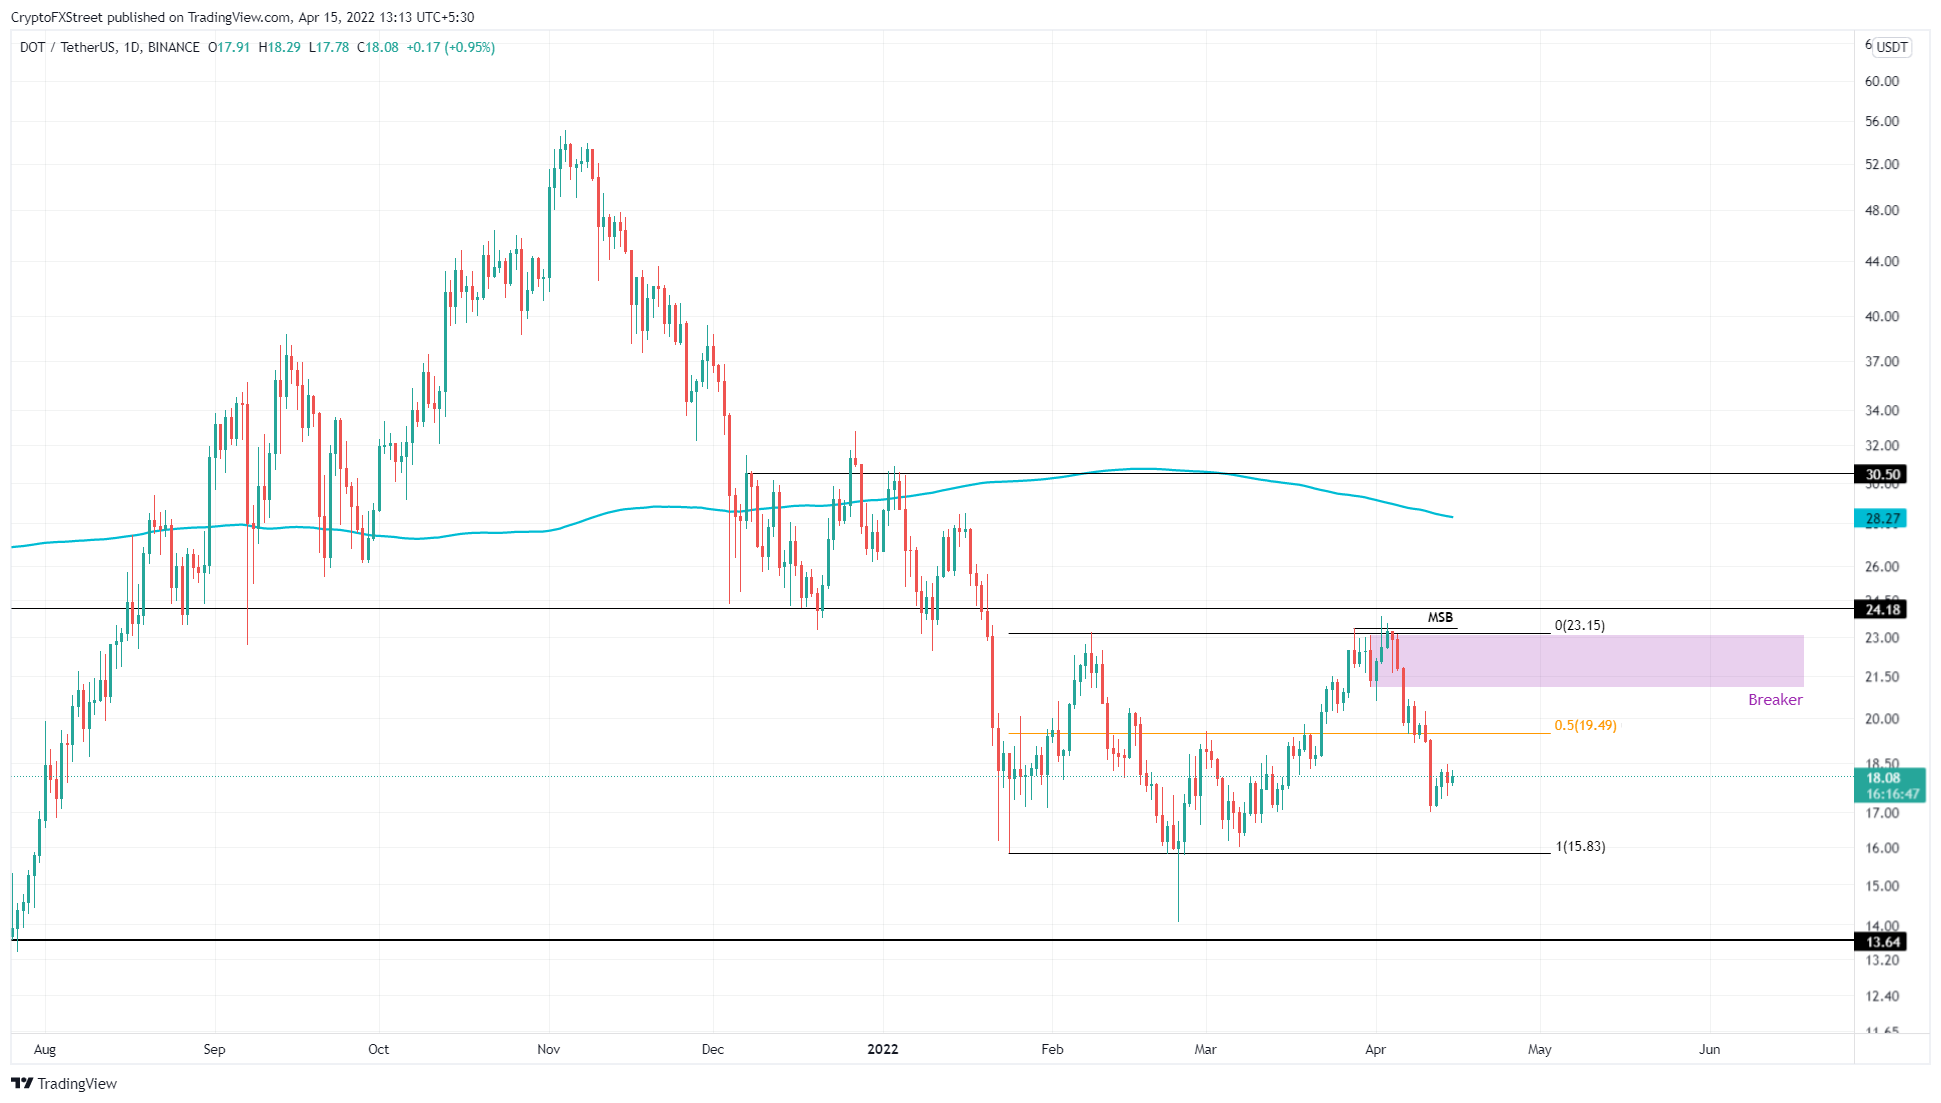
DOT/USDT 1-day chart
While things are looking optimistic for Polkadot price, a surge in selling pressure that leads to the breakdown of the range low at $15.83 will create a lower low. This development will also invalidate the bullish thesis. In such a case, sidelined buyers should wait for a retest of $13.64 to start reaccumulating.
Author

Akash Girimath
FXStreet
Akash Girimath is a Mechanical Engineer interested in the chaos of the financial markets. Trying to make sense of this convoluted yet fascinating space, he switched his engineering job to become a crypto reporter and analyst.