8.6 billion lost from Total Value Locked triggers massive liquidations of the Solana price
- Solana price reports 8.68 billion lost from Total Value Locked this year.
- The Relative Strength Index has printed a new low on the 4-Day Chart.
- Invalidation of the downtrend is a breach above $58.25.

Solana price shows bearish signals that may linger in the Smart Contract's investor sentiment for months. Traders should consider looking for better opportunities.
Solana price may have gone too far
Solana price shows disturbing signals to end the third week of June's trading session. The bears have suppressed prices into the $30 dollar range, a price level unseen since July 2021. An increase of volume has poured in, which is rather peculiar as the price has yet to recover substantially from the $28 low that occurred Monday, June 13.
Solana price currently trades at $32. The 4-day chart communicates a very bearish narrative as the Relative Strength Index has printed an all-time low at the 28 level. Investors keen to the technical analysis guidelines by renowned author Constance Brown know that a market bottom is rarely ever valid during the first new low printed on the RSI. Even if/when a significant pullback occurs, Solana price is now highly at risk for an "out of nowhere" style sell-off to restore balance to the RSI's reading.
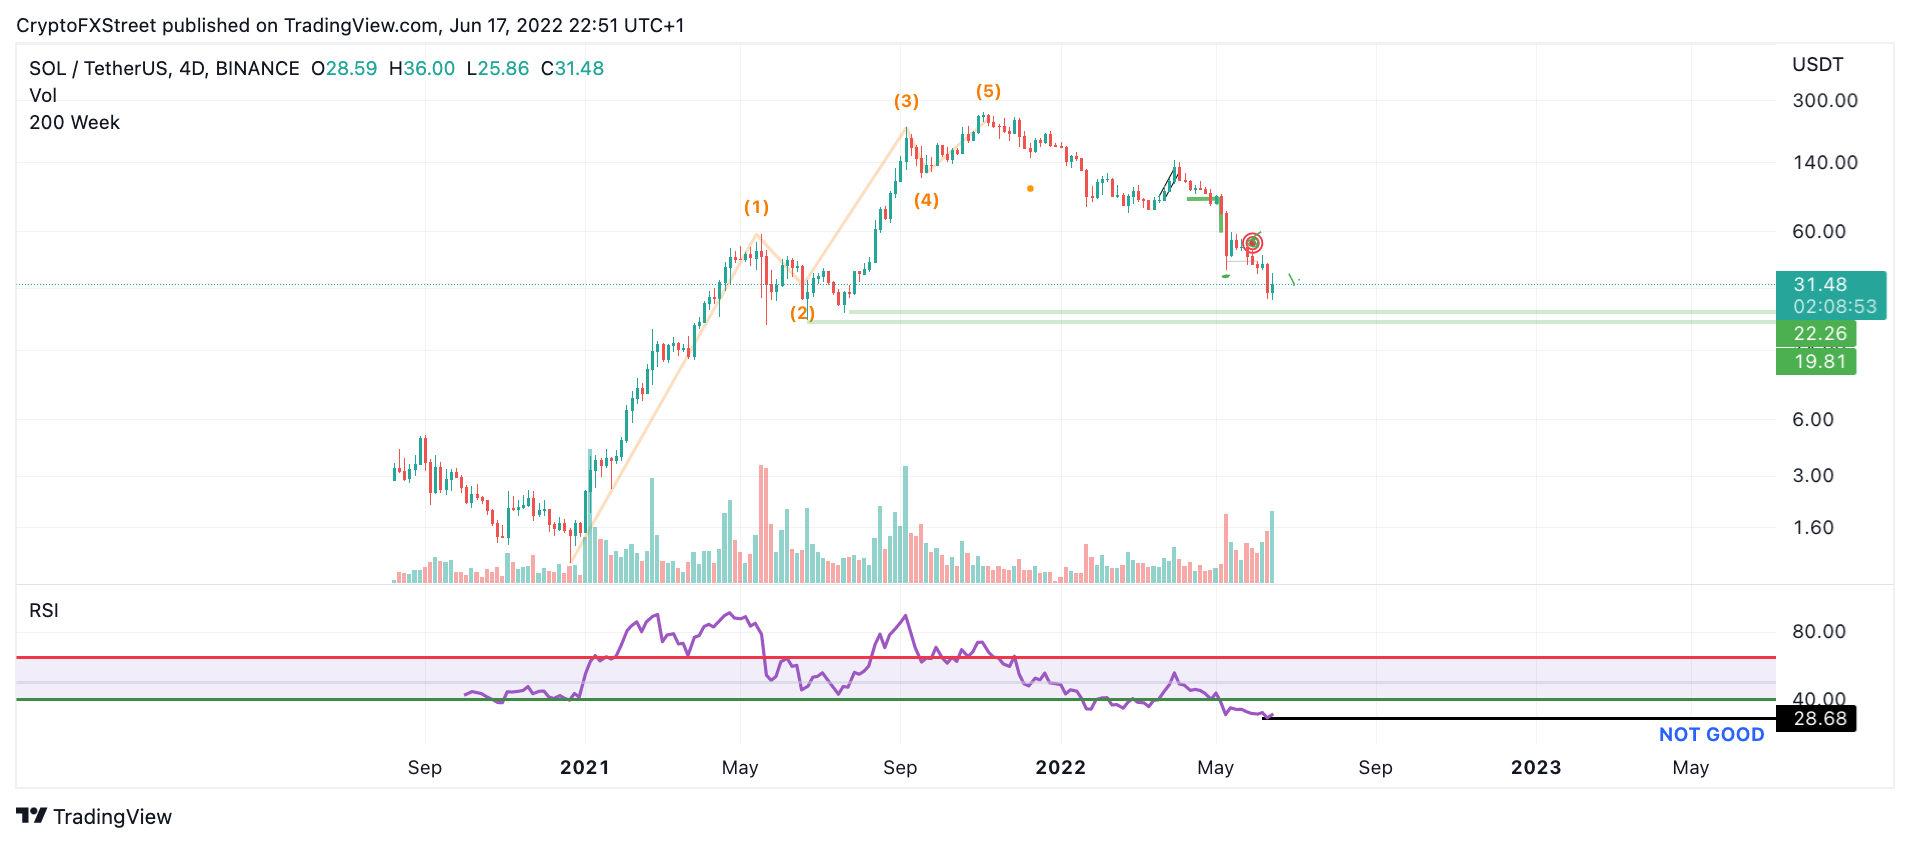
SOL/USDT 4-Day Chart
The demise of the Centralized Smart Contract token is also visible throughout the on-chain metrics. According to Defi Llama's on-chain analytics software, Solana has lost 8.68 billion dollars from its Total Value Locked smart contract metrics. The almost 10 billion dollar decline confounds the technicals' free-fall decline from Solana's All-time high at $253.
Still and invalidation of the downtrend can still occur. If the bulls can breach $58.25, they may be able to pull off a countertrend rally into $120, resulting in a 200% increase from the current Solana price.
Author

Tony M.
FXStreet Contributor
Tony Montpeirous began investing in cryptocurrencies in 2017. His trading style incorporates Elliot Wave, Auction Market Theory, Fibonacci and price action as the cornerstone of his technical analysis.


