Will this propel the markets even higher?

USD: Jun '24 is Up at 105.945.
Energies: Jun '24 Crude is Down at 81.52.
Financials: The June '24 30 Year T-Bond is Down 2 ticks and trading at 114.15
Indices: The Jun '24 S&P 500 emini ES contract is 68 ticks Higher and trading at 5064.50.
Gold: The Jun'24 Gold contract is trading Down at 2314.30.
Initial conclusion
This is a nearly correlated market. The USD is Up and Crude is Down which is normal, but the 30 Year T-Bond is trading Lower. The Financials should always correlate with the US dollar such that if the dollar is Higher, then the bonds should follow and vice-versa. The S&P is Higher and Crude is trading Lower which is correlated. Gold is trading Lower which is correlated with the US dollar trading Up. I tend to believe that Gold has an inverse relationship with the US Dollar as when the US Dollar is down, Gold tends to rise in value and vice-versa. Think of it as a seesaw, when one is up the other should be down. I point this out to you to make you aware that when we don't have a correlated market, it means something is wrong. As traders you need to be aware of this and proceed with your eyes wide open. Asia is trading Higher with the exception of the Shanghai exchange. Currently all of Europe is trading Higher.
Possible challenges to traders
-
Flash Manufacturing PMI is out at 9:45 AM EST. This is Major
-
Flash Services PMI is out at 9:45 AM EST. This is Major.
-
New Home Sales is out at 10 AM EST. This is Major.
-
Richmond Manufacturing Index is out at 10 AM EST. This is Major.
Treasuries
Traders, please note that we've changed the Bond instrument from the 30 year (ZB) to the 10 year (ZN). They work exactly the same.
We've elected to switch gears a bit and show correlation between the 10-year bond (ZN) and the S&P futures contract. The S&P contract is the Standard and Poor's, and the purpose is to show reverse correlation between the two instruments. Remember it's likened to a seesaw, when up goes up the other should go down and vice versa.
Yesterday the ZN migrated Lower at around 9 AM EST as the S&P hit a Low at around the same time. If you look at the charts below the S&P gave a signal at around 9 AM and the ZN started its Upward climb. Look at the charts below and you'll see a pattern for both assets. S&P hit a High at around 9 AM and migrated Lower. These charts represent the newest version of MultiCharts and I've changed the timeframe to a 15-minute chart to display better. This represented a Long opportunity on the 10-year note, as a trader you could have netted about a dozen ticks per contract on this trade. Each tick is worth $15.625. Please note: the front month for both the ZN and the S&P are now Jun '24. I've changed the format to filled Candlesticks (not hollow) such that it may be more apparent and visible.
Charts courtesy of MultiCharts built on an AMP platform
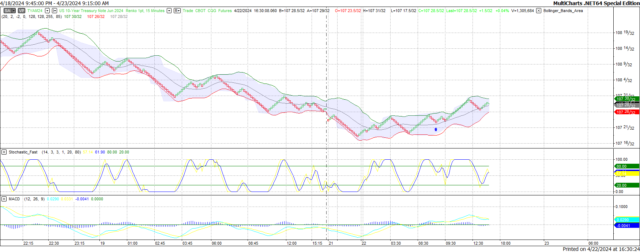
ZN -Jun 2024 - 04/22/24
-638494701683642167.png)
S&P - Jun 2024 - 04/22/24
Bias
Yesterday we gave the markets an Up bias and the markets didn't disappoint. The Dow gained 254 points and the other indices gained ground as well. Today we're dealing with a nearly correlated market and our bias is to the Upside.
Could this change? Of Course. Remember anything can happen in a volatile market.
Commentary
Yesterday we gave the markets an Upside bias as Crude, the Bonds and Gold were all trading Lower, and this usually represents an Upside Day. The markets didn't disappoint as they finally traded Higher after 6 consecutive down days (S&P). Today we have more economic news than we've seen in a number of days. New Home Sales, Richmond Manufacturing Index are all Major and proven market movers. Will this propel the markets even Higher? As in all things, only time will tell.
Author

Nick Mastrandrea
Market Tea Leaves


