Wholesale Inventories Surge, Sales Don't, Bond Market Panic

Inventories are up 7.7 percent from a year ago. Sales are up 2.7 percent.
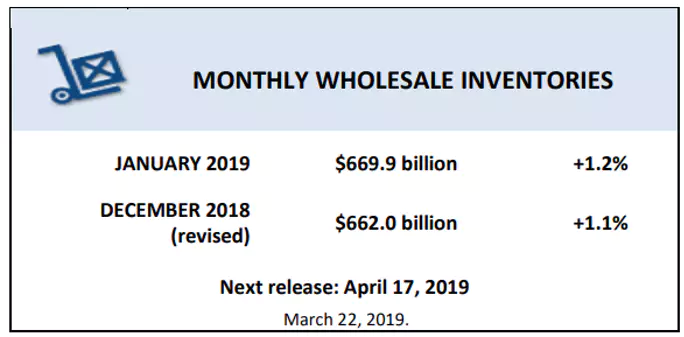
The Monthly Wholesale Trade report for January shows inventories rose 1.2% in January following a revised 1.1% in December.
Sales
January 2019 sales of merchant wholesalers, except manufacturers’ sales branches and offices, after adjustment for seasonal variations and trading day differences but not for price changes, were $499.8 billion, up 0.5 percent from the revised December level and were up 2.7 percent from the January 2018 level. The November 2018 to December 2018 percent change was revised from the preliminary estimate of down 1.0 percent to down 0.9 percent.
Inventories
Total inventories of merchant wholesalers, except manufacturers’ sales branches and offices, after adjustment for seasonal variations but not for price changes, were $669.9 billion at the end of January, up 1.2 percent from the revised December level. Total inventories were up 7.7 percent from the revised January 2018 level.
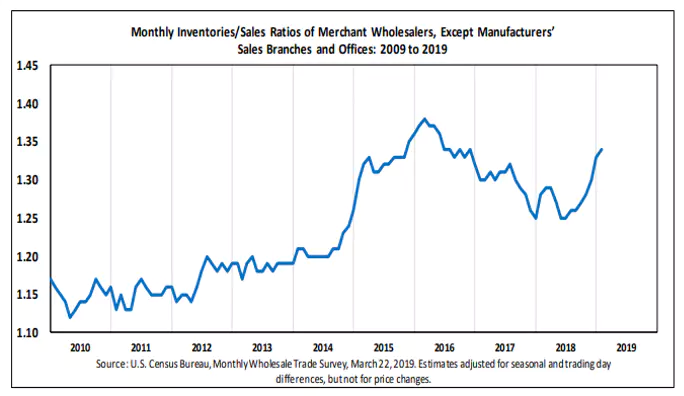
Inventories/Sales Ratio
The January inventories/sales ratio for merchant wholesalers, except manufacturers’ sales branches and offices, based on seasonally adjusted data, was 1.34. The January 2018 ratio was 1.28.
Econoday Consensus
The Econonoday consensus estimate was for a 0.1% rise in inventories in a range of -0.1% to +0.1%.
There are few indications of economic slowing that are more convincing than an unwanted build in inventories -- and that apparently is what's underway in the wholesale sector. Wholesale inventories jumped 1.2 percent in January to far exceed anyone's expectations and are up 7.7 percent year-on-year. Confirmation that this is unwanted comes from sales in the sector which did rise 0.5 percent in January but follow a long stretch of contraction. Year-on-year, sales are up only 2.7 percent. The sector's stock-to-sales ratio continues to climb, at 1.34 vs 1.33 in December and against 1.28 in January last year. Today's data confirm the wisdom of the Federal Reserve's cautious outlook.
Oops!
Total Business Inventory-to-Sales
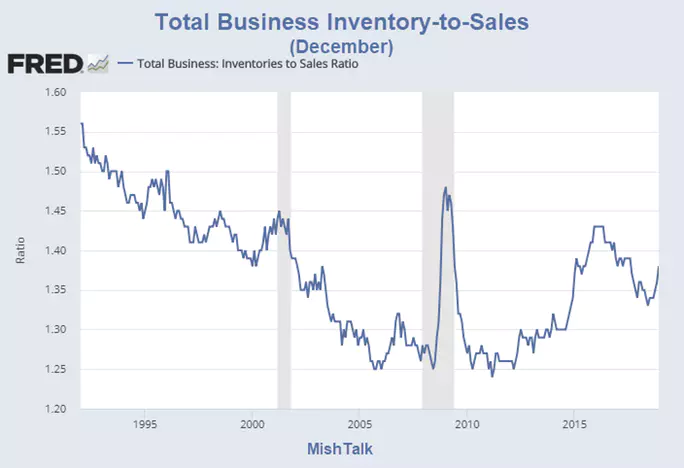
The Census department did not update total inventory-to-sales numbers today. Thus the above chart is stale.
Compared to years prior to 2000, these numbers don't indicate a huge problem. Compared to years between 2005 and 2015, the numbers do seem to be a problem.
Bond Market Panic
I strongly sense a huge build in inventories to total sales.
That is the message from the near panic in the bond market today where yields inverted nearly across the board.
For discussion, please see Near Full Inversion: 10-Year Note Inverts With 1-Month T-Bill.
Author

Mike “Mish” Shedlock's
Sitka Pacific Capital Management,Llc
Mike “Mish” Shedlock is a registered investment advisor for SitkaPacific Capital Management.


