What will upcoming OPEC+ mean for Oil prices?

What are the macro-economic, geopolitical, and technical factors driving oil prices this week?
Macroeconomics
On the macroeconomic view, the greenback has kept falling lower against a basket of major currencies – the DXY thus remains further below its yearly regression channel now, while eyeing the next quarterly S2 pivot just located at the $100 mark.
The President of the Federal Reserve (Fed), Jerome Powell, signaled on Wednesday (Nov. 30th) a possible inflection of the monetary policy of the Fed as soon as this month.
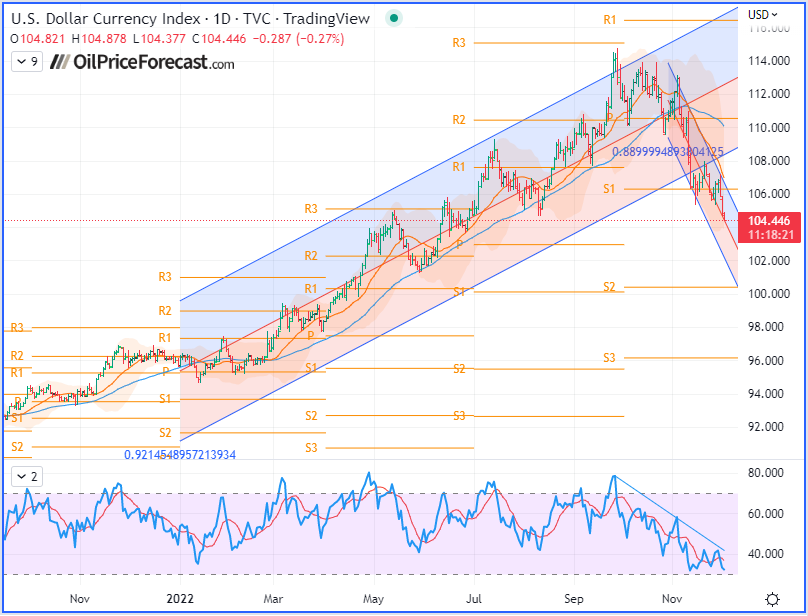
US Dollar Currency Index (DXY), daily chart
Geopolitical and fundamental analysis
Oil prices ended on a mixed note Thursday (Dec 1st), in the grip of the suspense surrounding the decision, expected this upcoming Sunday, of the Organization of the Petroleum Exporting Countries and their allies (OPEC+) on its production quotas. The cartel meeting will take place on Sunday in a delicate context, marked by the fall in oil prices and the entry into force of new sanctions against Russia. Its members will thus hold a virtual meeting by videoconference, one day before the start of the EU's embargo on imports of Russian crude, which must be accompanied by a price cap. They should vote for a renewal of the previous decision relating to a reduction of 2 million barrels per day, according to an Iranian source, the market being very uncertain with the imminent arrival of a new series of sanctions against Russia.
All members of the European Union, except for Poland (which had pushed for the lowest possible cap), tentatively agreed on Thursday to cap the price of Russian oil transported by sea at $60 a barrel, according to an EU diplomat. This agreement would be accompanied by a readjustment mechanism to maintain the price cap 5% below market price. Following the implementation of such a price cap model, European carriers and insurers will be able to process orders for Russian crude placed by non-EU countries, provided that the latter undertake to pay a price lower than or equal to this cap. However, all this fuss probably won't have much effect on the market since the Russians will simply find other customers to sell their crude oil to.
US Crude Oil inventories
Commercial crude oil reserves fell sharply last week in the United States, according to figures released Wednesday by the United States Energy Information Agency (EIA), a decline attributed in part to the acceleration of the refinery activity, from below 94% capacity the previous week to 95.2%.
Another element that could explain the significant contraction in commercial stocks is the slowdown in imports (-14%) combined with the acceleration in exports (+16%) of crude oil.
In addition to commercial stocks, strategic reserves also fell last week, by 1.4 million barrels.
Furthermore, last week was both Thanksgiving holiday and Black Friday sales. It's supposed to be a good week for fuel consumption, but it came out down 5% year-on-year.
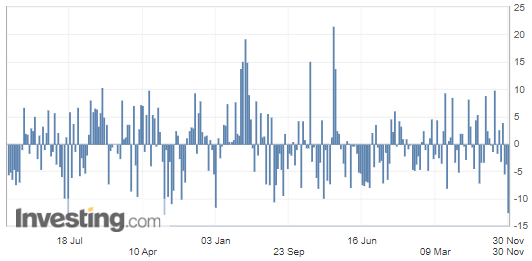
(Source: Investing.com)
Technical charts
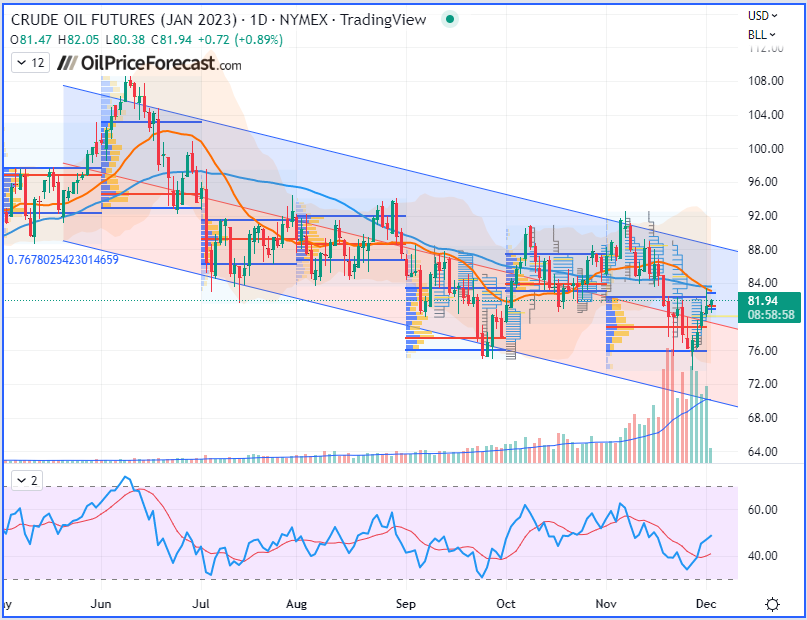
WTI Crude Oil (CLF23) Futures (January contract, daily chart)
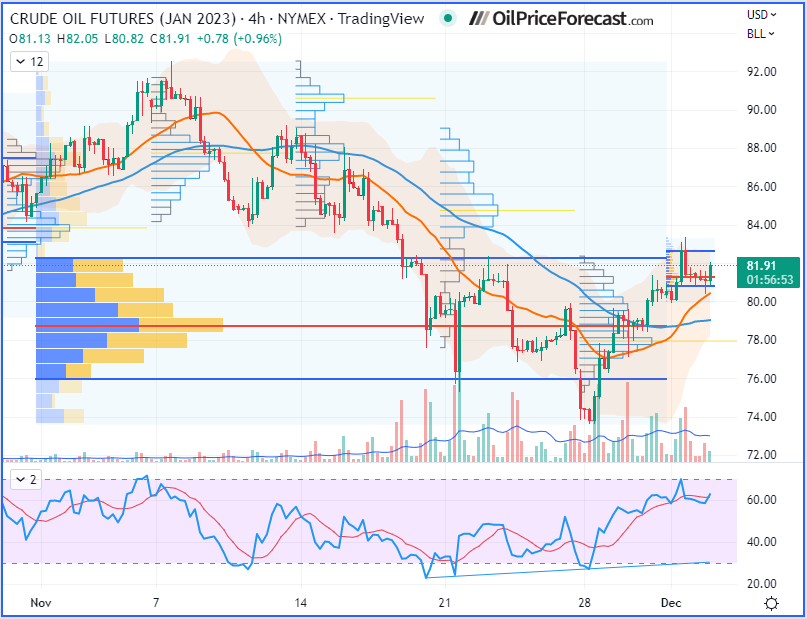
WTI Crude Oil (CLF23) Futures (January contract, 4H chart)
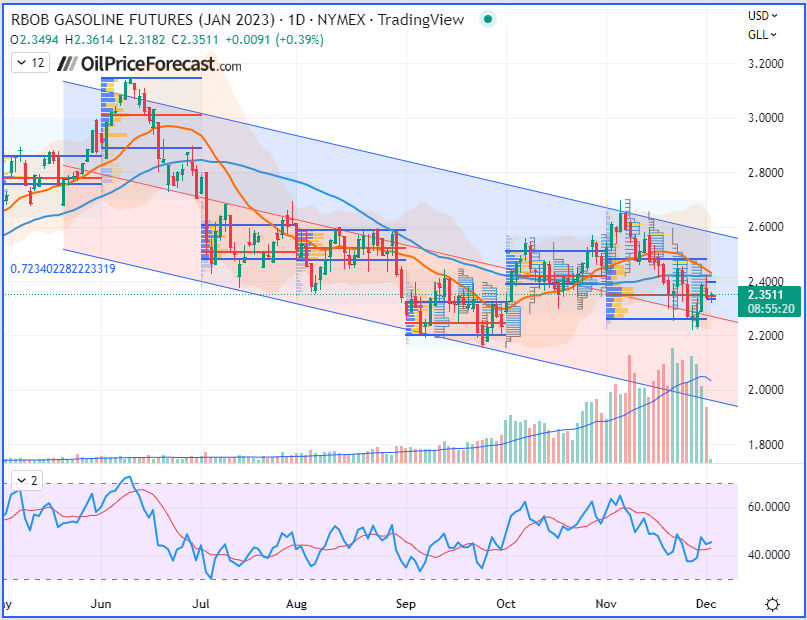
RBOB Gasoline (RBF23) Futures (January contract, daily chart)
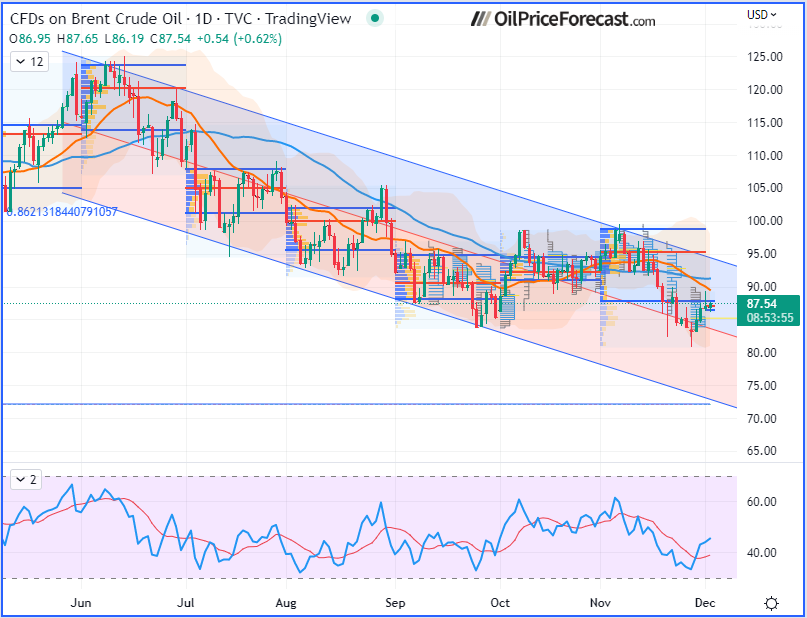
Brent Crude Oil (BRNG23) Futures (February contract, daily chart) – Contract for Difference (CFD) UKOIL
Want free follow-ups to the above article and details not available to 99%+ investors? Sign up to our free newsletter today!
Want free follow-ups to the above article and details not available to 99%+ investors? Sign up to our free newsletter today!
Author

Sébastien Bischeri
Sunshine Profits
Sebastien Bischeri is a former Reserve Officer in the French Armed Forces (Navy), and began his career in computer science and engineering, prior to move into banking, finance, and trading.


