What dynamics drive the Silver price?

Understanding silver pricing can be tricky because of the metal’s dual nature. It is an industrial commodity, but fundamentally, silver is money.
A recent report by the Silver Institute attempts to untangle the various factors that go into the price of silver, noting that it’s a difficult job.
“The Report finds that no magic formula or combination of factors consistently and accurately explains the level of or change in the silver price. While the price of silver is not a random walk, neither is its future path entirely predictable based on past trends.
Industrial and technical applications account for roughly half of silver demand. In that sense, you will sometimes see the price movements correlate with the broader commodity complex.
But at its core, silver is money. That brings other factors into the pricing equation such as the strength of the dollar or the trajectory of interest rates. That means silver typically moves with gold, especially over the long run.
“Supply/demand analysis is complicated by silver’s legacy as a monetary metal and its continued acceptance as an investable asset. The result is that above-ground stocks of bullion and investment demand play an outsized role in silver compared to other 'purer' commodities, such as copper or palladium, where stocks are much smaller and investor interest far narrower and shallower. In this regard, silver is closer to gold, whose price to an even greater extent is subject to changes of ownership in its huge level of above-ground bullion stocks and in investor sentiment towards the precious metal.
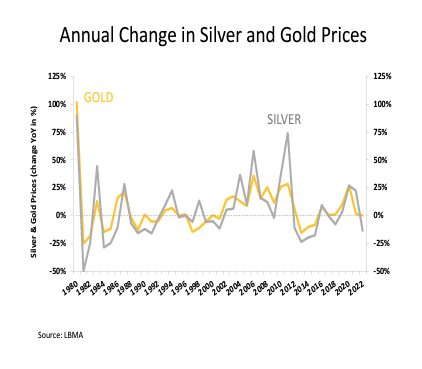
As you can see from the charm silver tends to outperform gold during a gold bull market.
Silver appears to be underpriced
Whether you’re considering industrial demand, the current monetary climate, or both, silver appears to be significantly underpriced.
Despite wishful thinking in the mainstream, inflation doesn’t appear to be down and out. And if it is, that just means a return to inflationary policies with the Fed trying to push down interest rates. That’s bullish for both gold and silver.
There is also a strong likelihood that something will break in the economy in the near future. The financial system isn’t built to operate in even a modestly high interest rate environment. The Federal Reserve would almost certainly respond to a financial crisis by slashing interest rates to zero and restarting quantitative easing (effectively printing money). These are inflationary policies. There are already signs of stress in the banking system and the commercial real estate market is ripe for a crisis.
When there is high inflation, smart people want to hold real money. This is bullish for gold and silver.
On the supply and demand side of the equation, silver is expected to hit the second-highest level on record in 2024.
Industrial demand for silver is expected to lead the growth in global demand, driven in part by the growth of the green energy sector. According to a 2022 research paper by scientists at the University of New South Wales, solar manufacturers could consume over 20 percent of the current annual silver supply by 2027. And by 2050, solar panel production will use approximately 85–98 percent of the current global silver reserves.
Even if the economy crashes, government commitment to green energy will likely keep the money in that sector.
The Silver Institute projects another market deficit in 2024 with demand outstripping supply. This would mark the fourth straight year of a structural market deficit and further cut into silver reserves.
Given these dynamics, at between $22 and $23 an ounce, silver is on sale.
The gold:silver ratio would appear to confirm the white metal is underpriced – at least in relation to gold.
The has spread to almost 90:1. That means it takes almost 90 ounces of silver to buy one ounce of gold. This is a historically widespread.
The average gold:silver ratio in the modern era has generally ranged between 40:1 and 60:1. When the ratio widens far beyond that range, as it has in recent years, it typically returns toward that mean.
For instance, the ratio fell to 30:1 in 2011 and below 20:1 in 1979.
The pandemic era provides a more recent example. As the Fed cut rates and launched quantitative easing to prop up a shaky economy caused by rate hikes the prior year, the gold:silver ratio climbed to nearly 93:1. As silver rallied along with gold, the gold:silver ratio plunged from over 100:1 to just over 64:1, close to the high end of the historical norm.
It's pretty clear that silver isn’t priced for the current demand dynamics.
The bottom line is no matter how you weigh the various factors that drive the price of silver, the white metal appears to be a bargain at the current price.
To receive free commentary and analysis on the gold and silver markets, click here to be added to the Money Metals news service.
Author

Mike Maharrey
Money Metals Exchange
Mike Maharrey is a journalist and market analyst for MoneyMetals.com with over a decade of experience in precious metals. He holds a BS in accounting from the University of Kentucky and a BA in journalism from the University of South Florida.