Weekly waves: EUR/USD, Bitcoin, and gold
-
Our weekly Elliott Wave analysis reviews the EUR/USD monthly chart, the Bitcoin cryptocurrency daily chart, and XAU/USD on the daily chart.
-
The EUR/USD monthly chart is testing a key support zone and trend line (green) and facing a decisive moment: will price action break or bounce?
-
The BTC/USD made a bearish reversal, which means that the bullish pattern is probably an ABC (blue) pattern.

EUR/USD faces decisive support zone
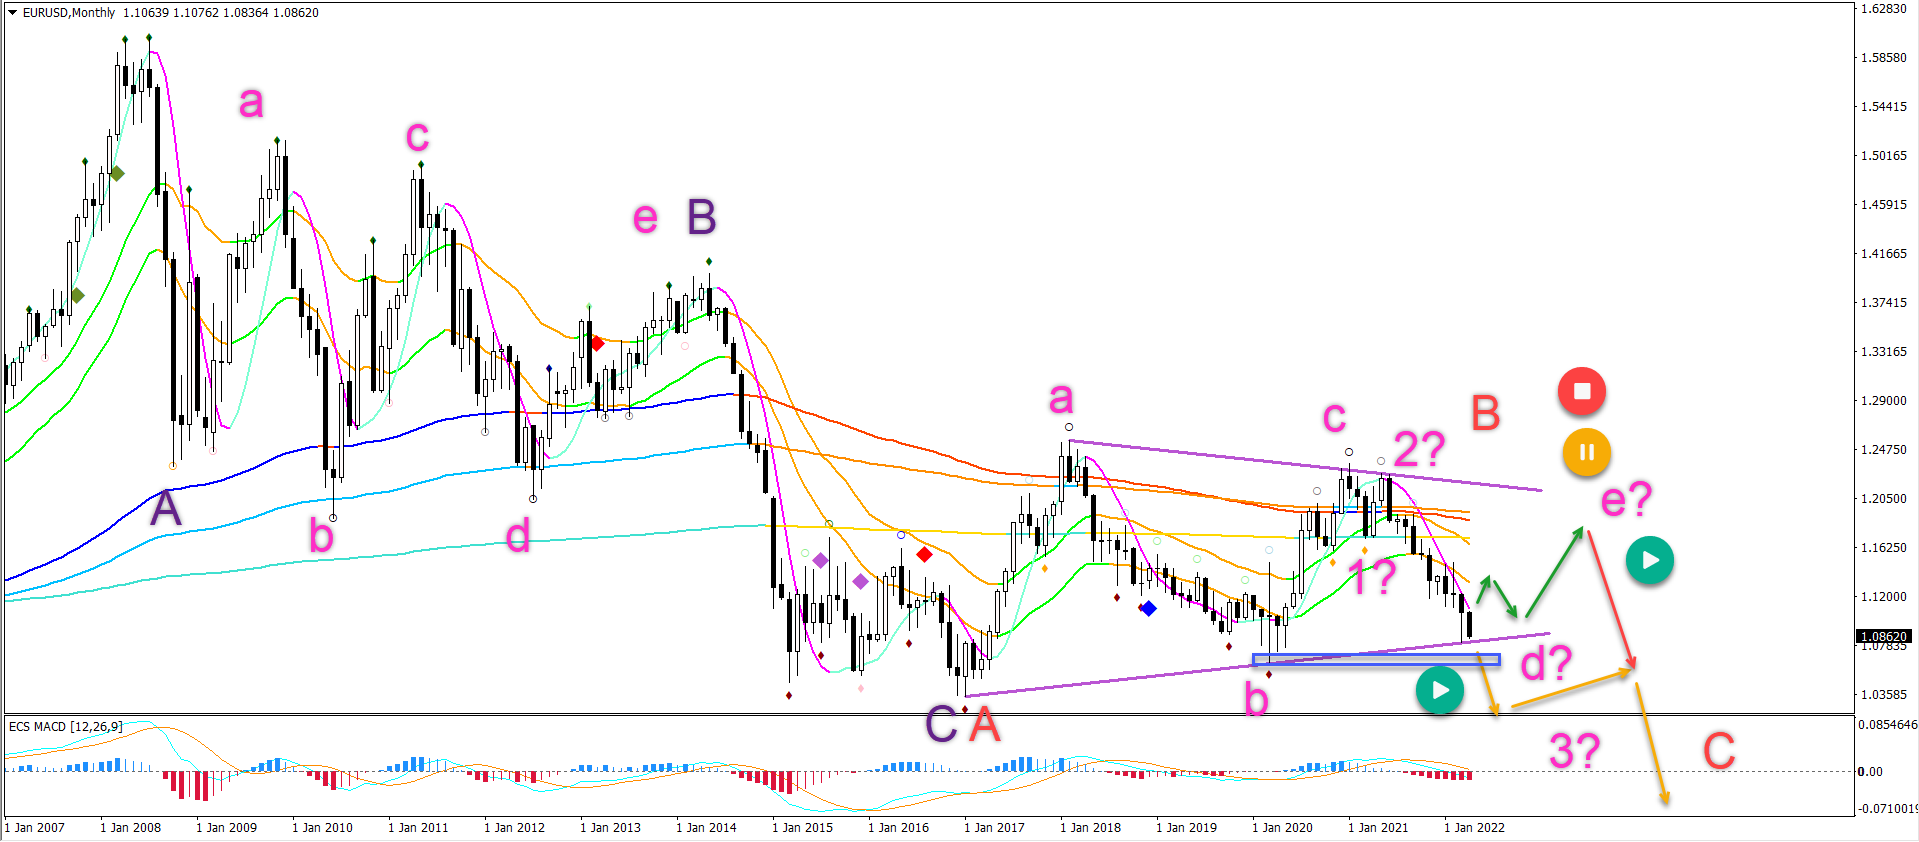
The EUR/USD monthly chart is testing a key support zone and trend line (green):
-
The EUR/USD is facing a decisive moment: will price action break or bounce?
-
The EUR/USD bullish bounce would confirm a potential ABCDE (pink) triangle pattern within wave B (red).
-
Price action needs to break above the opening of this month and last month’s high. An ABC up could be expected within wave E (pink).
-
The EUR/USD bearish breakout would indicate an immediate downtrend. In that case, price action completed an ABC (pink) correction and is making a decline within a 123 (pink) of wave C (red).
BTC/USD bearish swing to rebound at Fibs
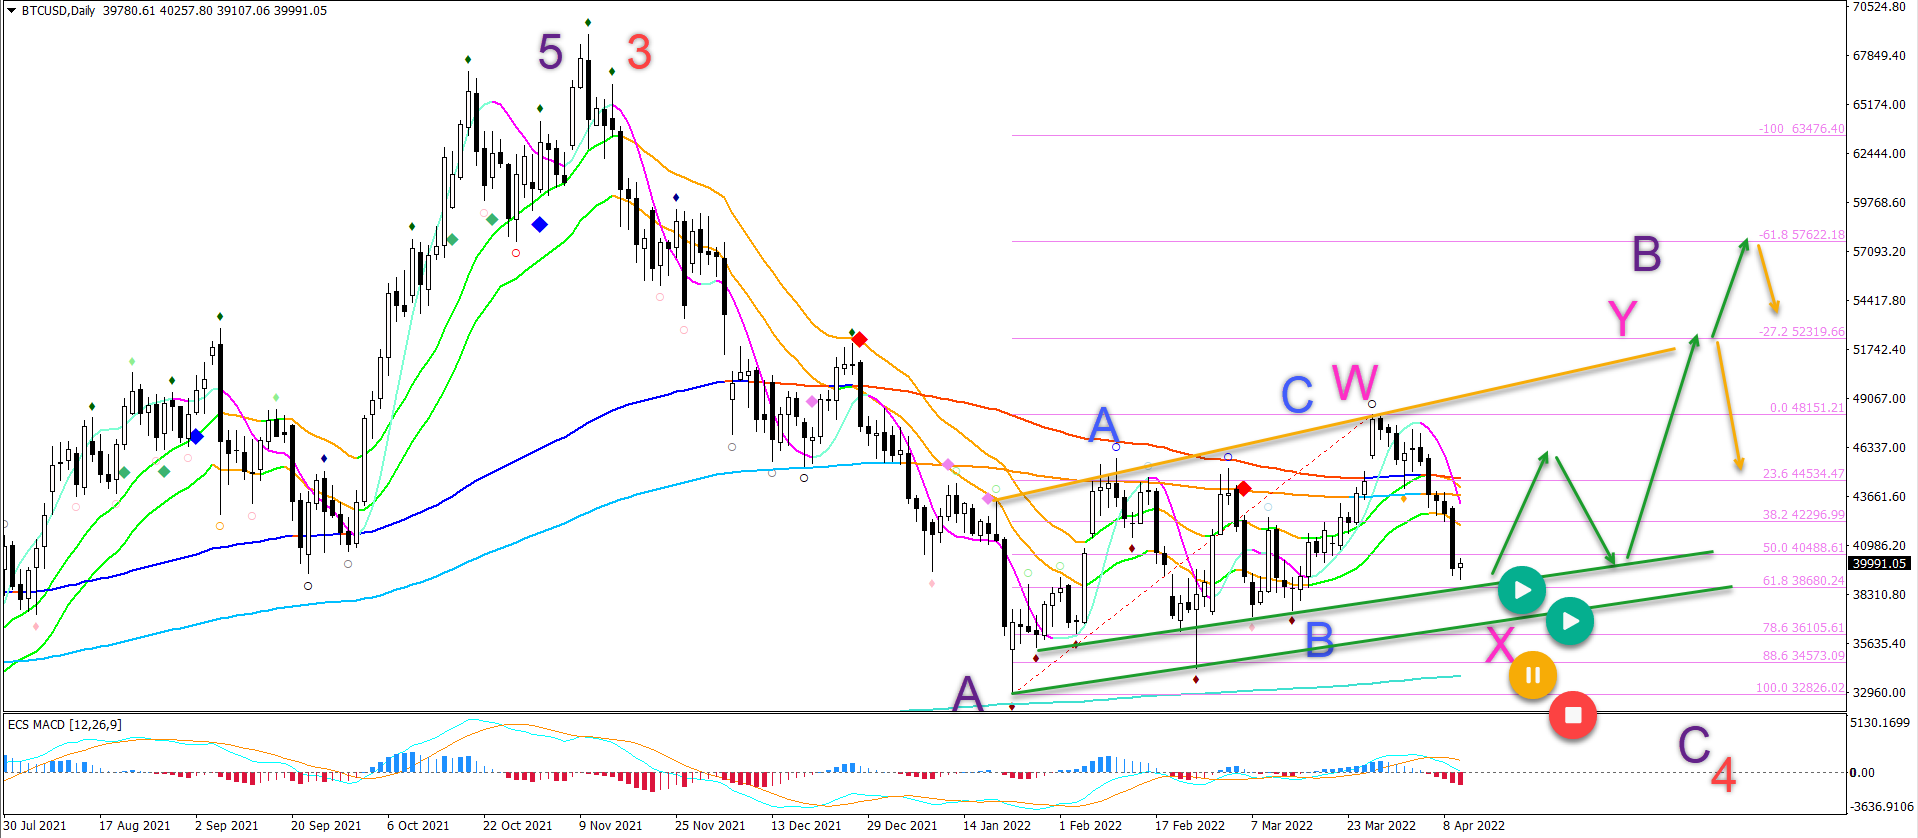
Bitcoin has made a small bearish reversal. Is the crypto currency looking for a downtrend or for a bounce, let’s review:
-
The BTC/USD made a bearish reversal, which means that the bullish pattern is probably an ABC (blue) pattern.
-
However, we expect price action to develop a larger bullish correction within wave B (purple).
-
Therefore, a bullish and expanded WXY (pink) pattern is the current favorite Elliott Wave pattern in wave B (purple).
-
A bullish bounce at the Fibonacci support levels would confirm it.
-
But a bearish breakout below the support zone would indicate it.
-
The main targets are located at the Fibonacci targets.
Gold pushing for a bullish breakout
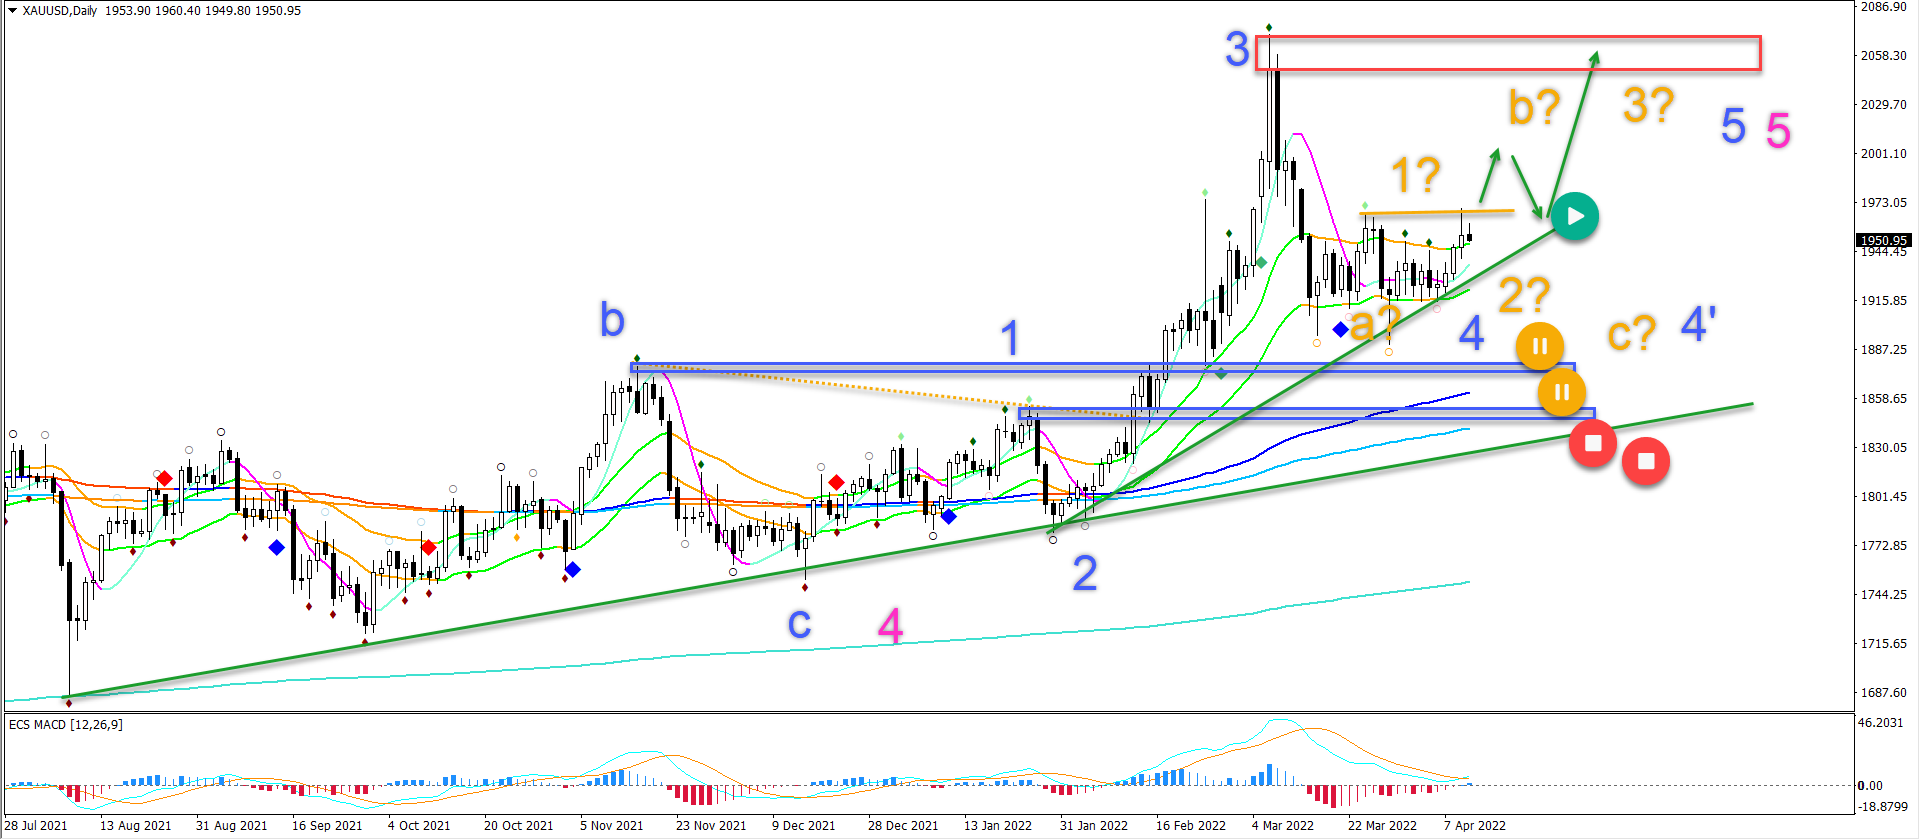
The XAU/USD has made a bullish bounce and is now testing the resistance:
-
The XAU/USD made a strong push up for a wave 3 (blue).
-
The retracement is probably a wave 4 (blue), although the wave 4 can be extended and complete itself at a later moment in time (blue 4’).
-
A breakout (green arrows) above the resistance (orange) could indicate an attempt to test the previous top.
-
A break below the previous tops (blue boxes) would invalidate the bullish outlook.
The analysis has been done with the indicators and template from the SWAT method simple wave analysis and trading. For more daily technical and wave analysis and updates, sign-up to our newsletter
Author

Chris Svorcik
FS method
Chris Svorcik is a trader, analyst, and educator with over 15 years of experience in financial markets, specializing in moving averages, market structure, and price patterns.


