USDX just bottomed – Will Gold really slide?
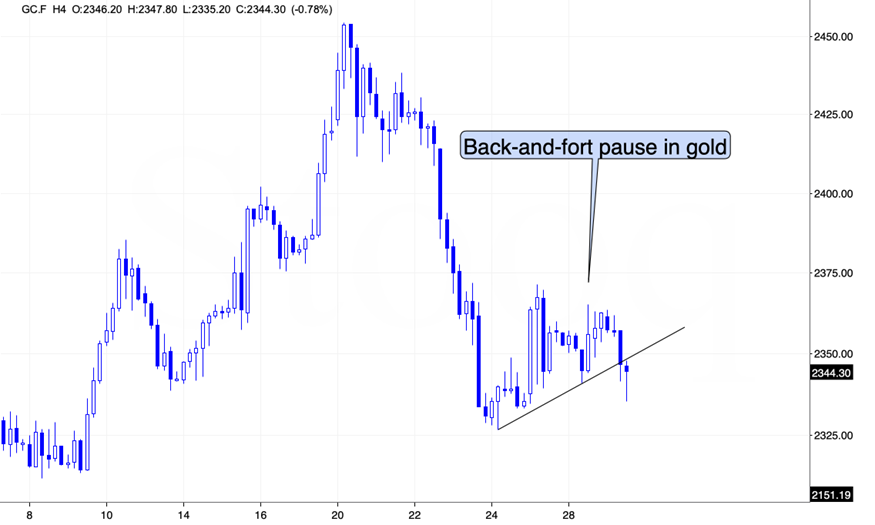
Back-and-forth movement. That’s what we’ve been expecting.
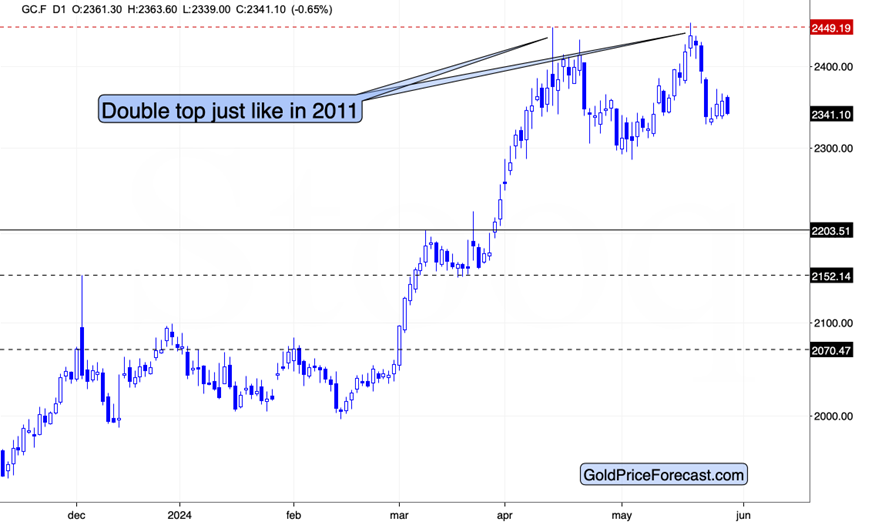
Back-and-forth movement in Gold
And that’s exactly what we see in gold. Today, we see the “forth” part as the yellow metal erases its recent gains. Just as the daily upswings didn’t really matter, today’s decline is of little meaning, as this is just a blip on the radar screen compared to what’s to come – at least based on the analogy to what we saw in 2011 after a similar double-top pattern.
At the moment of writing these words, gold futures are trading several dollars lower than about 24 hours ago, so what I wrote yesterday and in my previous analyses remains perfectly up-to-date.
One new thing that I’d like to add is that gold is after a breakdown below its very short-term support line that’s based on the very recent lows, which is a bearish sign for the short term.
And moving to my previous, but up-to-date, analysis:
This is in perfect tune with what happened in 2011 after gold’s double-top, and with what. I wrote previously.
Quoting my Friday’s comments:
First of all, even though the [current plunge] is volatile, we may need to see more back-and-forth trading before gold plunges more substantially.
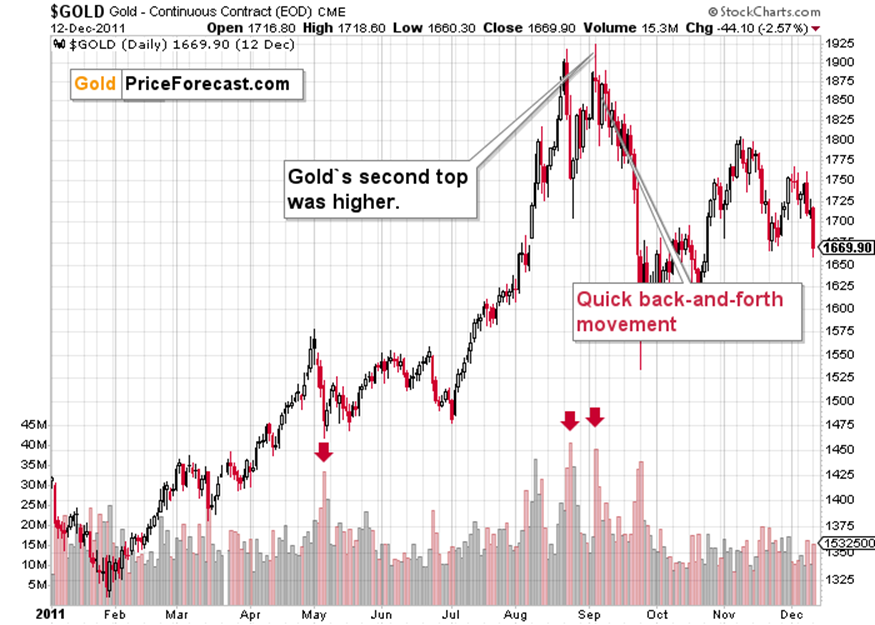
The two tops and the bottom between them serve as good reference point for other price moves. After gold’s second 2011 top, it quickly declined to the midpoint between the local bottom and the final top and then it bounced back, then it declined some more, then it bounced back and so on. In other words, the back-and-forth type of movement continued.
Gold price is now [below] the midpoint between the local bottom and the final top, so we might see a quick rebound from here, and the back-and-forth movement based on bigger daily moves.
This is just a possibility, not a sure bet – if the USD Index soars, gold can plunge right away.
And that plunge would be likely to materialize anyway. Once gold does indeed plunge, it would likely stop in $2,150 - $2,200 area – between the previous lows and highs. Back in 2011, gold price managed to briefly slide below the local tops before bouncing.
Then, a bigger short-term rally happened in gold, but I don’t think we’ll see one in this case. A smaller one (perhaps a $40-$80 rally) yes, but not something much bigger. The reason is the situation in the USD Index – gold appears to have finally re-started to respond to its daily rallies with declines, and the USDX itself is likely to rally profoundly in the medium term.
Yesterday, I added the following:
In fact, gold’s performance now can be described as weak, given that the USD Index moved lower in the last few days.
The weak reaction in gold implies that gold now “wants” to decline further – most likely in tune with its 2011 price pattern.
Of course, gold has no internal “will” to move lower – the above is a thought short-cut, which describes the current sentiment among gold investors/traders with lots of capital.
If a market “wants” to move higher, it will be more or less ignoring that, which usually makes it decline. We have the opposite – gold is ignoring USD Index’s decline, which usually makes it rally.
And since the USD Index just moved to its rising support line, it seems that the days (hours?) of USD Index’s correction as well as days (hours?) of gold’s rebound are numbered.
It seems that the next move up in the USDX and the next move down in the precious metals market (including mining stocks) is just around the corner.
Market sentiment and future movements
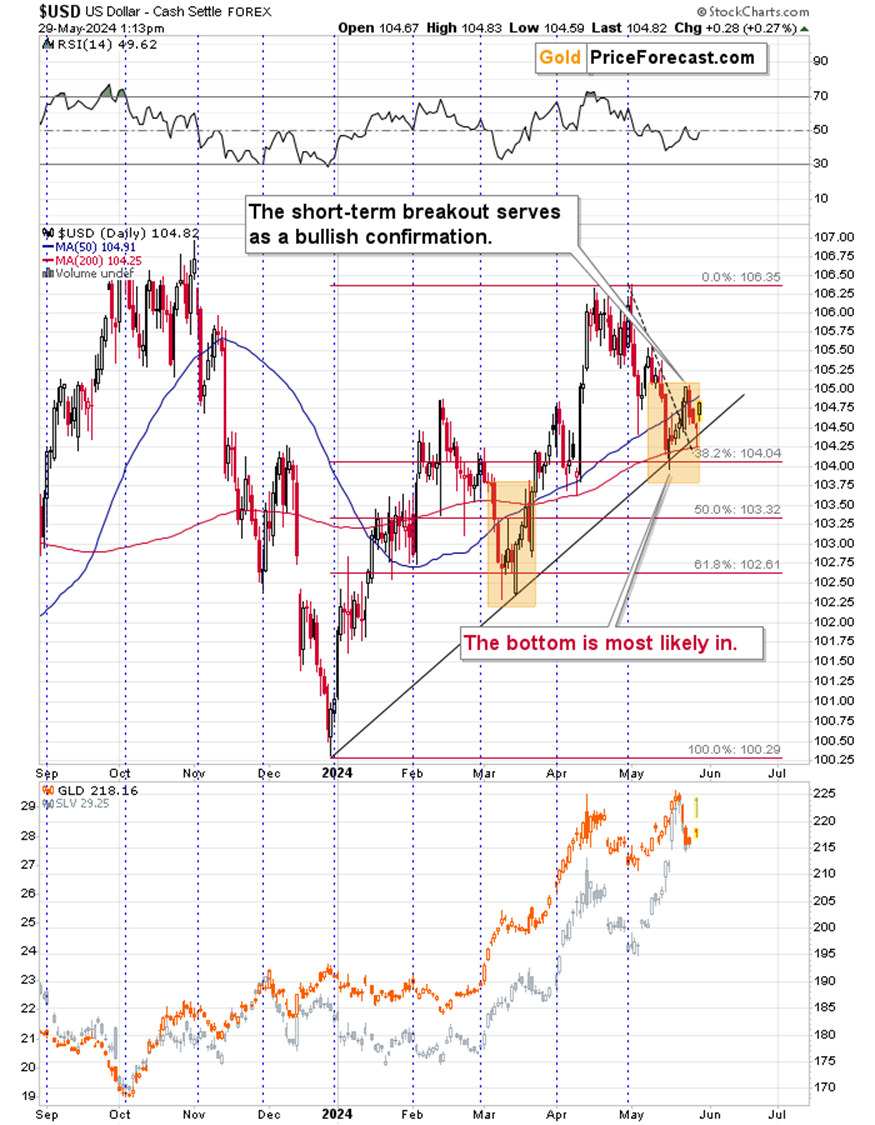
That’s exactly what we saw – the USD Index reversed slightly below its rising support line (invalidating the tiny breakdown, which is a buy signal on its own), and it bottomed there.
This quick rebound is also in perfect tune with what we saw in the second half of March, shortly after the USD Index bottomed at the same support line. The history is rhyming, and the next verse is about a sizable rally in the USDX.
As you saw in today’s pre-market trading, gold is reacting to U.S. dollar’s strength, so the above is likely to translate into lower precious metals prices.
Thank you for reading today's free analysis.
Want free follow-ups to the above article and details not available to 99%+ investors? Sign up to our free newsletter today!
Want free follow-ups to the above article and details not available to 99%+ investors? Sign up to our free newsletter today!
Author

Przemyslaw Radomski, CFA
Sunshine Profits
Przemyslaw Radomski, CFA (PR) is a precious metals investor and analyst who takes advantage of the emotionality on the markets, and invites you to do the same. His company, Sunshine Profits, publishes analytical software that any


