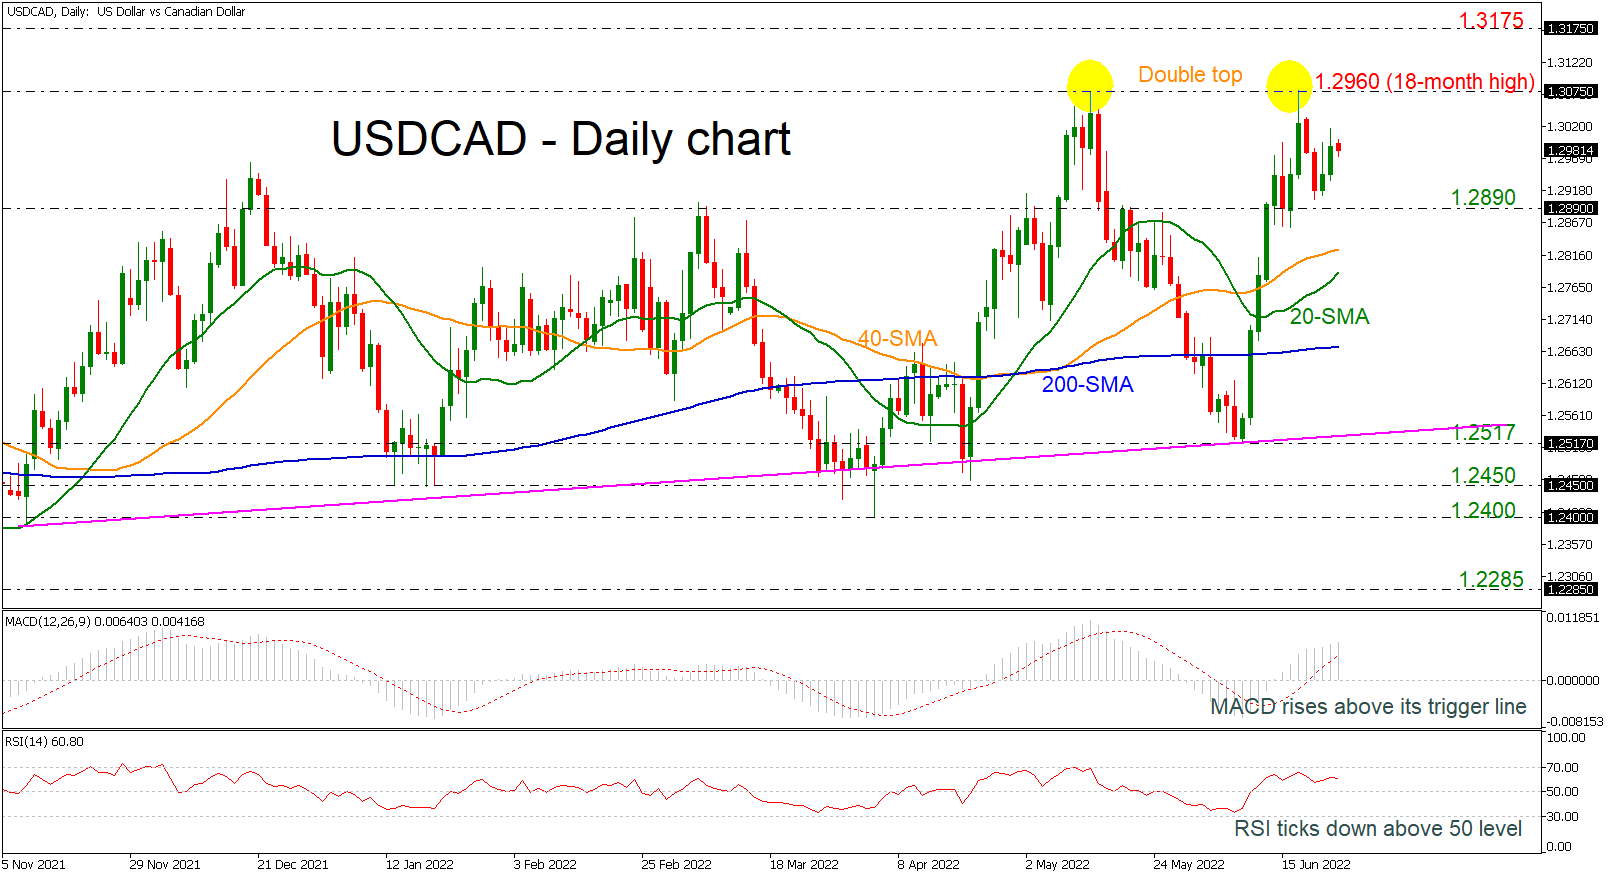
USD/CAD shows weak signs below double top at 1.2960
USDCAD is showing some weak signs today with the technical indicators confirming this view. The RSI indicator is moving south in the positive region, while the MACD oscillator is holding above its trigger and zero lines, but with softer momentum than before.
The price posted a double top around the 18-month high of 1.2960 in the previous weeks and any moves higher could boost the long-term bullish outlook. Moving up, the price may meet the 1.3175 barrier, taken from the peak of November 2020, ahead of the 1.3420 level, registered in September 2020.
On the other hand, if the price heads down, immediate support could come from the 1.2980 support and the 40- and 20-day simple moving averages (SMAs) at 1.2825 and 1.2785, respectively. A drop lower may drive the bears until the flat 200-day SMA at 1.2660 before tumbling to 1.2517.
All in all, USDCAD has been in an advancing mode over the last seven months, though only a significant climb above the double top may endorse this positive outlook.
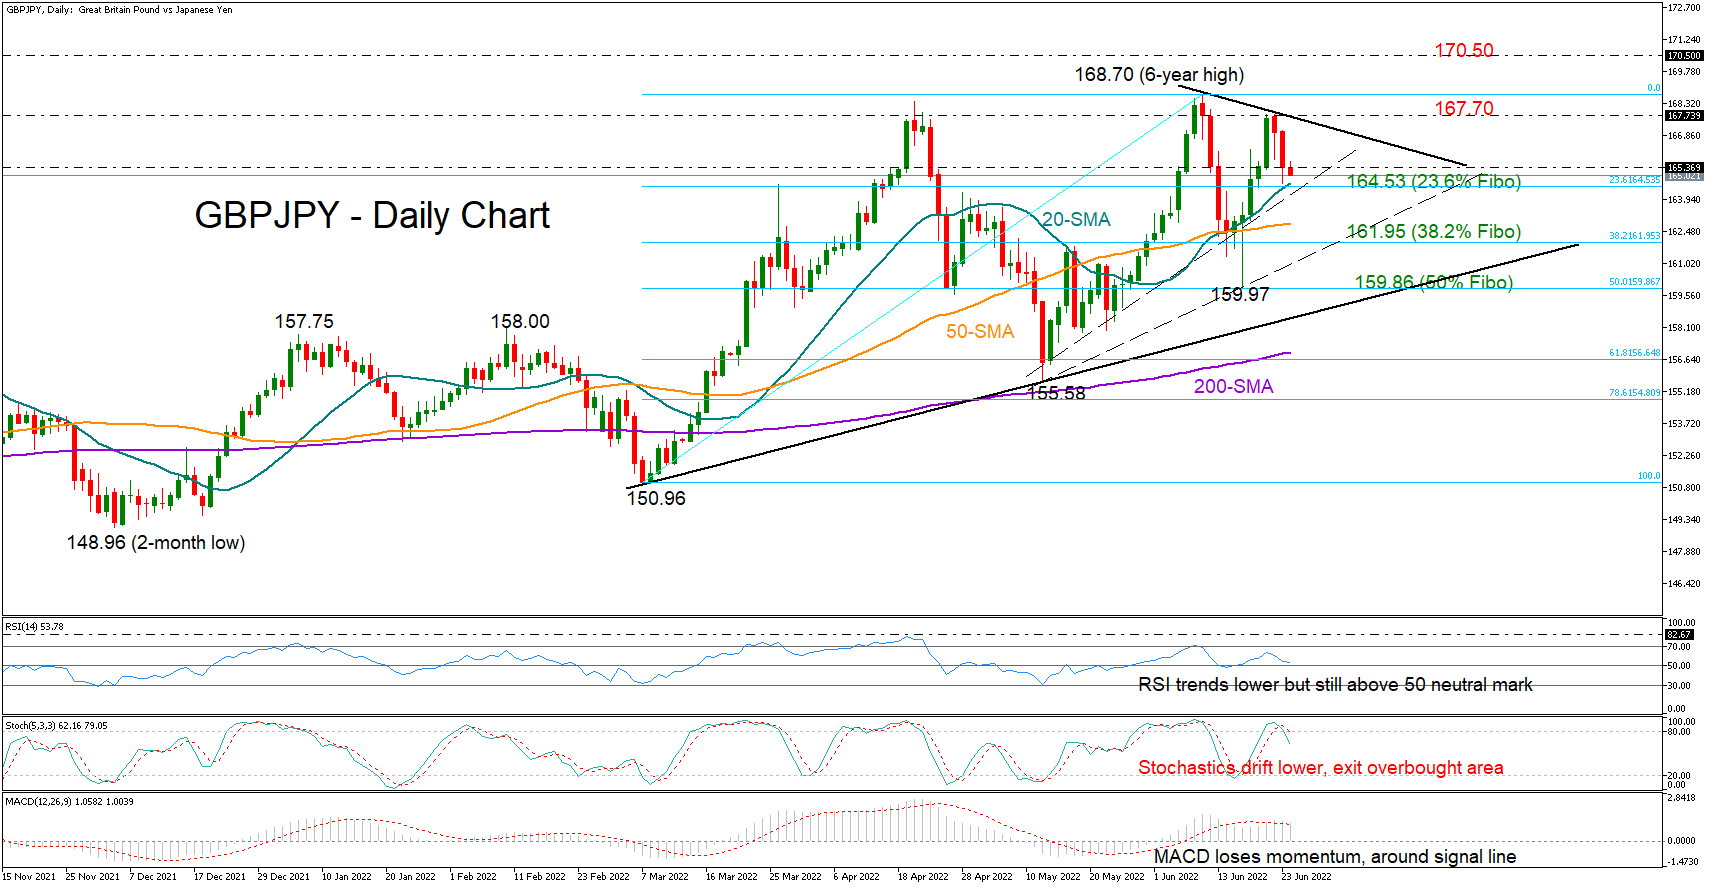
GBP/JPY bullish trend dims
GBPJPY is mirroring fading buying interest as negative momentum escalated on Thursday, confirming a lower high at 167.82.
Similarly, the RSI seems to be following a negative trajectory after failing to reach its previous high, while the negative turn in the Stochastics and the MACD is also reflecting some discomfort among traders.
Optimism, however, has not completely vanished as the 20-day simple moving average (SMA), which has been a crucial support region over the past week, is still intact. The 23.6% Fibonacci retracement of the 150.96 – 168.70 upleg is also in the same neighborhood at 164.53 along with a dashed ascending trendline. If selling tendencies, however, break that floor, the 50-day SMA currently at 162.11 may immediately come under the spotlight ahead of the 50% Fibonacci of 161.95. Slightly lower, a tentative upward-sloping trendline may attract some attention around 161.00 before traders target the 61.8% Fibonacci of 159.86.
Alternatively, should the 20-day SMA cease downside pressures, the pair may push for a close above the short-term tentative resistance trendline and the 167.70 former restrictive zone. In case the bulls accelerate above the six-year high of 168.70 too, the next barricade may pop up somewhere near 170.50 taken from January-February 2016.
In brief, the positive trend in GBPJPY seems to be losing steam, though the bulls may not give up the battle yet unless the base at 164.53 collapses.
Forex trading and trading in other leveraged products involves a significant level of risk and is not suitable for all investors.
Recommended Content
Editors’ Picks

GBP/USD bulls retain control near 1.3300 mark, highest since March 2022
The GBP/USD pair trades with a positive bias for the third straight day on Friday and hovers around the 1.3300 mark during the Asian session, just below its highest level since March 2022 touched the previous day.

EUR/USD grapples with higher ground as Fed cuts weigh on Greenback
EUR/USD found the high end on Thursday, holding fast to the 1.1150 level, though most of the pair’s bullish momentum comes from a broad-market selloff in the Greenback rather than any particular bullish fix in the Euro.

Gold consolidates weekly gains, with sight on $2,600 and beyond
Gold price is looking to build on the previous day’s rebound early Friday, consolidating weekly gains amid the overnight weakness in the US Dollar alongside the US Treasury bond yields. Traders now await the speeches from US Federal Reserve monetary policymakers for fresh hints on the central bank’s path forward on interest rates.

Shiba Inu is poised for a rally as price action and on-chain metrics signal bullish momentum
Shiba Inu remains strong on Friday after breaking above a symmetrical triangle pattern on Thursday. This breakout signals bullish momentum, further bolstered by a rise in daily new transactions that suggests a potential rally in the coming days.

Bank of Japan set to keep rates on hold after July’s hike shocked markets
The Bank of Japan is expected to keep its short-term interest rate target between 0.15% and 0.25% on Friday, following the conclusion of its two-day monetary policy review. The decision is set to be announced during the early Asian session.

Moneta Markets review 2024: All you need to know
VERIFIED In this review, the FXStreet team provides an independent and thorough analysis based on direct testing and real experiences with Moneta Markets – an excellent broker for novice to intermediate forex traders who want to broaden their knowledge base.