USD remains soft ahead of US Consumer Confidence

EUR/USD:
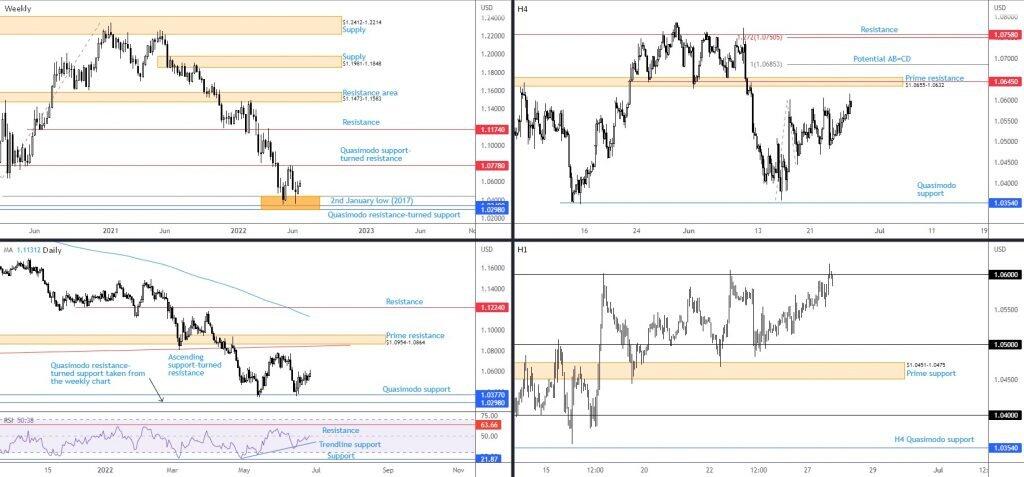
Monday welcomed reasonably upbeat data out of the US; durable goods orders increased 0.7 per cent, versus the market consensus of 0.1 per cent. The US dollar immediately witnessed a bid against its major peers (US Dollar Index), though the move was short-lived and topped around 104.21 to finish the session lower. EUR/USD, therefore, pursued higher levels, tackling space north of the widely watched $1.06 figure (H1). Although sellers could make a show from this psychological number, H4 prime resistance at $1.0655-1.0632 remains strategically positioned above to facilitate a ‘deeper’ stop-run (a setup that could encourage a bearish phase).
Higher up on the curve, weekly support is still in the spotlight between $1.0298-1.0445, made up of a Quasimodo resistance-turned support at $1.0298, 2nd January low at $1.0340 (2017), and a 100% Fibonacci projection at $1.0445 (AB=CD harmonic bullish formation). As you can see, price has been bid from this area since early May. However, weekly Quasimodo support-turned resistance from $1.0778 capped buyers in early June, in a market reflecting a primary bear trend since 2021. Adding to this, seen from the monthly timeframe, the vibe has been to the downside since topping in April 2008. The trend, as noted in recent writing, is likely one of the main factors discouraging any meaningful buying from current weekly support.
Technical Expectation:
Outlook largely unchanged from previous analysis.
A higher run on stops above $1.06 may draw a fakeout to H4 prime resistance nearby at $1.0655-1.0632. For the most part, a $1.06 whipsaw on the H1 might be considered a bearish play, as sellers (in line with the overall trend) may enter from $1.0655-1.0632, attempting to fade buy-stop momentum.
Nevertheless, traders are encouraged to also remain aware that the EUR/USD is currently bid from higher timeframe support, in spite of a decisive downtrend.
AUD/USD:
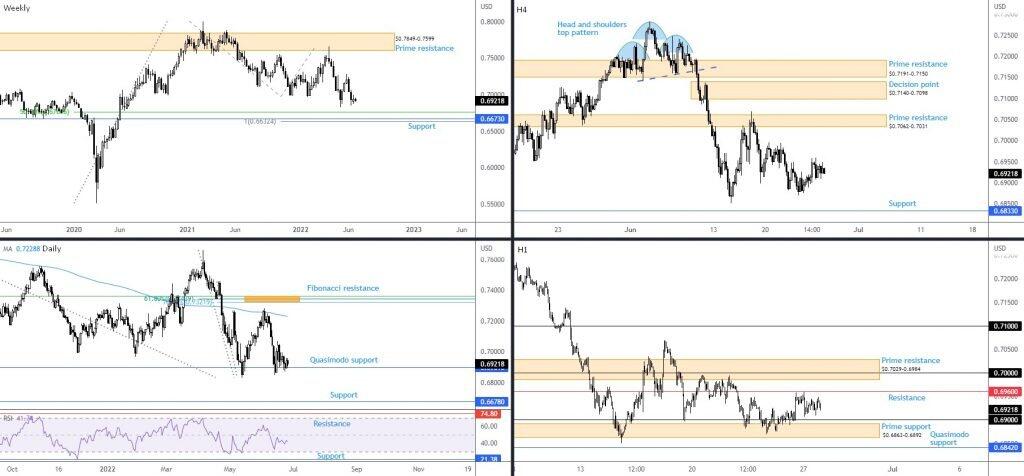
AUD/USD performance was limited on Monday, ranging between $0.6959 and $0.6907. Overall, technically speaking, I remain bearish in the medium term. The rationale behind this falls largely on the back of trend direction. Here is what I noted in Monday’s weekly technical briefing:
The monthly timeframe has portrayed a downtrend since August 2011, indicating the rally from the pandemic low of $0.5506 (March 2020) to a high of $0.8007 (February 2021) on the weekly timeframe is likely viewed as a deep pullback among long-term chartists. Downside from the 2021 February top (an early primary bear trend), therefore, is potentially seen as a move to explore lower over the coming weeks.
On top of this, the weekly timeframe demonstrates scope to explore lower levels until reaching support between $0.6632 and $0.6764 on the bigger picture, composed of a 100% Fibonacci projection, a price support, and a 50% retracement. Furthermore, we remain south of the 200-day simple moving average on the daily timeframe at $0.7229, together with daily Quasimodo support from $0.6901 threatening to give way and the relative strength index (RSI) set beneath its 50.00 centreline (negative momentum). Note that $0.6901 has failed to motivate buying since mid-June.
Against the backdrop of higher timeframe action, H1 resistance demands attention at 0.6960, while continuation buying unearths H1 prime resistance at $0.7029-0.6984 (set beneath H4 prime resistance at $0.7062-0.7031) and, of course, the widely watched $0.70 figure established within. Downstream, though, points the finger to $0.69 and a familiar H1 prime support at $0.6863-0.6892.
Technical Expectation:
Similar outlook to Monday’s report:
Given psychological values are prone to whipsaws, particularly big figures like $0.70, a run above the number could play out if we retest H1 prime resistance at $0.7029-0.6984, which may trigger bearish flow. However, do bear in mind that circling just above the H1 zone is H4 prime resistance drawn from $0.7062-0.7031, indicating a whipsaw of $0.7029-0.6984 is also possible.
Both setups are considered bearish, in line with the overall downtrend.
USD/JPY:
USD/JPY modestly scaled higher on Monday, braced amid rising US Treasury yields and a risk-off mood. In spite of yesterday’s bid, the technical picture remains mostly unchanged and will, therefore, reflect thoughts echoed in Monday’s weekly technical briefing.
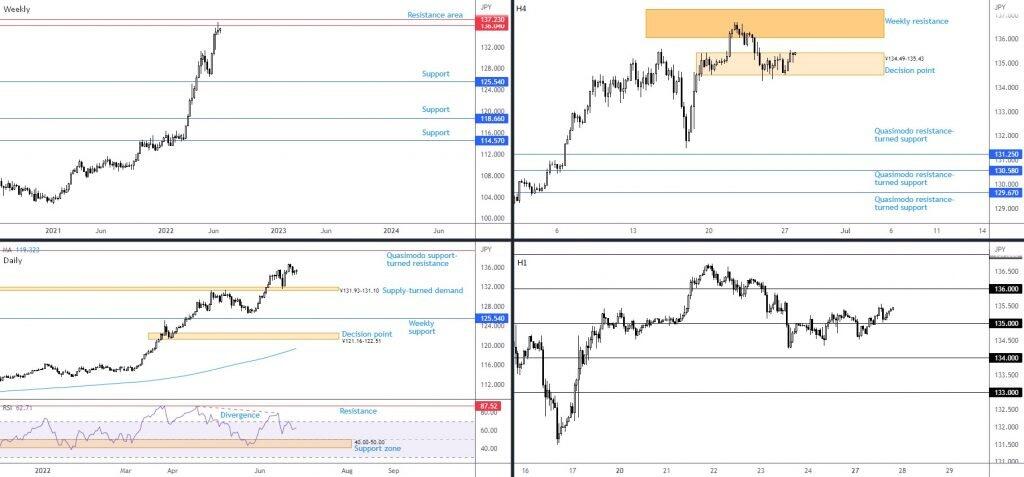
Despite the USD/JPY touching highs at ¥136.71 (levels not seen since 1998), in a market decisively trending higher since 2021, momentum noticeably slowed in recent trading. Last week’s action printed a half-hearted shooting star (bearish) candlestick pattern from weekly resistance, made up between ¥137.23 and ¥136.04. Support, for those looking lower, remains obvious at ¥125.54 (tucked under the ¥126.36 swing low [24th May]).
Supply-turned demand at ¥131.93-131.10 on the daily chart merits consideration as price responded from the zone in mid-June. While current weekly resistances are on my immediate radar, the daily timeframe throws up another resistance alternative just above the weekly lines at ¥139.55, a Quasimodo support-turned resistance.
The current weekly resistances also remain the main focus on the H4. After a dip from the weekly resistance zone, a H4 decision point from ¥134.49-135.43 greeted price and appears to be holding ground.
Technical Expectation:
Having seen H1 price reclaim ¥135+ status, together with room to climb on the daily timeframe (to ¥139.55) in a market clearly trending northbound, buyers may still be in the driving seat. While price has struggled to find grip around ¥135, current efforts to hold the number might prove sufficient for buyers to take aim at ¥136.
GBP/USD:
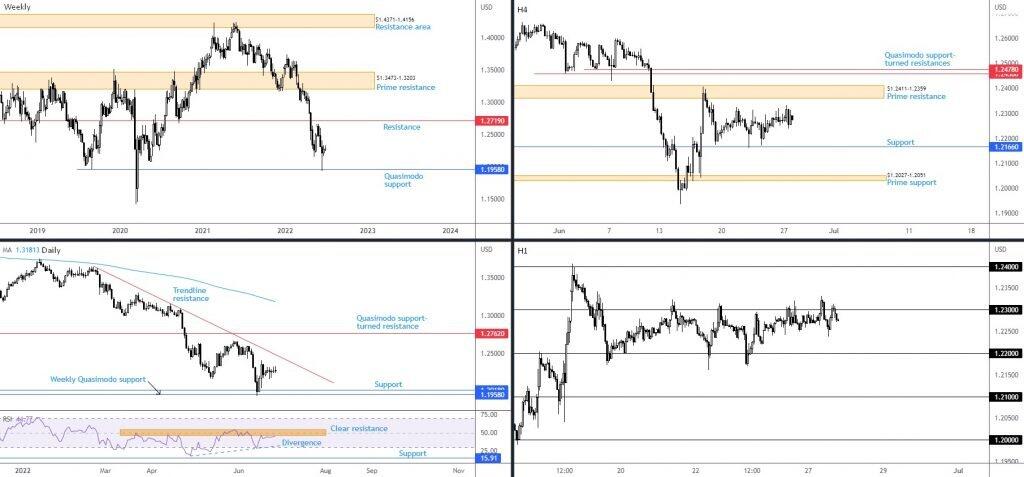
Sterling wrapped up Monday off best levels against the US dollar, relinquishing the majority of earlier gains from $1.23 amid US hours. Note that $1.23 has served well as short-term resistance since 21st June; still, conviction (from sellers) appears fatigued and implies $1.23 is likely to step aside in upcoming trade, a move exposing $1.24. Interestingly, though, should a $1.23 breach unfold, breakout buyers are encouraged to pencil in H4 prime resistance at $1.2411-1.2359 as this area, albeit having its range tested (may have weakened the zone), could still cap buying.
Across the page, weekly Quasimodo support at $1.1958 remains in the picture. Though upside momentum diminished last week, the $1.1958 response could drum up sufficient backing to reach trendline resistance on the daily timeframe, taken from the high $1.3639. A bearish reaction from the trendline resistance is supported by the trend. I noted the following in regards to current trend and also the relative strength index (RSI) in recent writing:
Trend direction in this market is unmistakably bearish, fashioning a series of lower lows/highs since February/May’s double-top formation at around $1.4241. Furthermore, seen through the monthly timeframe, the long-term downtrend has actually been soft since late 2007 tops at $2.1161.
We can see the RSI is testing resistance around the 50.00 centreline, following positive divergence. Voyaging above 50.00 is a sign of positive momentum and could push for a test of the noted trendline resistance.
Technical Expectation:
Given the lacklustre performance on Monday, the technical outlook is unchanged for the time being:
The reaction from weekly Quasimodo support at $1.1958 may encourage buying to draw price towards daily trendline resistance. It is here that sellers may decide to put on a show, in keeping with the overall downtrend. This translates to a possible $1.23 breach to the upside in the short term (H1), and possible rally to at least $1.24ish.
Author

Aaron Hill
FP Markets
After completing his Bachelor’s degree in English and Creative Writing in the UK, and subsequently spending a handful of years teaching English as a foreign language teacher around Asia, Aaron was introduced to financial trading,


